
Organizational Hierarchy
Morphospace
Hierarchy Models
Hierarchy is a critical component of organizational structure. Human resource management focuses strongly on the need for deeply rooted order within organizations to ensure that they are extracting the optimum output from their employees. Yet, nowadays, there seems to be a perceived correlation between hierarchy, or the lack thereof, and innovation. In the golden era of startups and the rise of small & medium enterprises, organizations are second-guessing the traditional rigid model of hierarchy and looking to implement flatter, less commanding setups to boost innovation, creativity, and overall employee morale.
This independent study conducted under the guidance of Dr. Joaquín Goñi attempts to codify four prominent models of hierarchy through generative models. The generative models are further randomized to disintegrate the staunch laws of hierarchy, in order to replicate the functioning of real-world organizations. Finally, the generated networks that emulate organizational structure are compared on relative scales of treeness, feedforwardness, and orderability within a network morphospace. A morphospace is a graphical representation of all the morphologies an organism could or does have (theoretically possible and existing based on physical limitations), each point of which represents an individual shape. As a part of a complex adaptive system research project, the organization was treated as an organism whose shapes could be modeled as different structures of its hierarchy. The results produced depict a the exhaustive set of organizational hierarchies that are theoretically possible and existing based on configured limitations
Glossary
Morphospace: A graphical representation of all the morphologies an organism could or does have, each point of which represents an individual shape. Here, the organization was treated as an organism whose shapes could be modeled as different structures of its hierarchy
Cytoscape: Cytoscape is an open-source bioinformatics software platform for visualizing molecular interaction networks and integrating them with gene expression profiles and other state data. Here the tool was used here to visualize interactions between nodes of the organization’s hierarchy
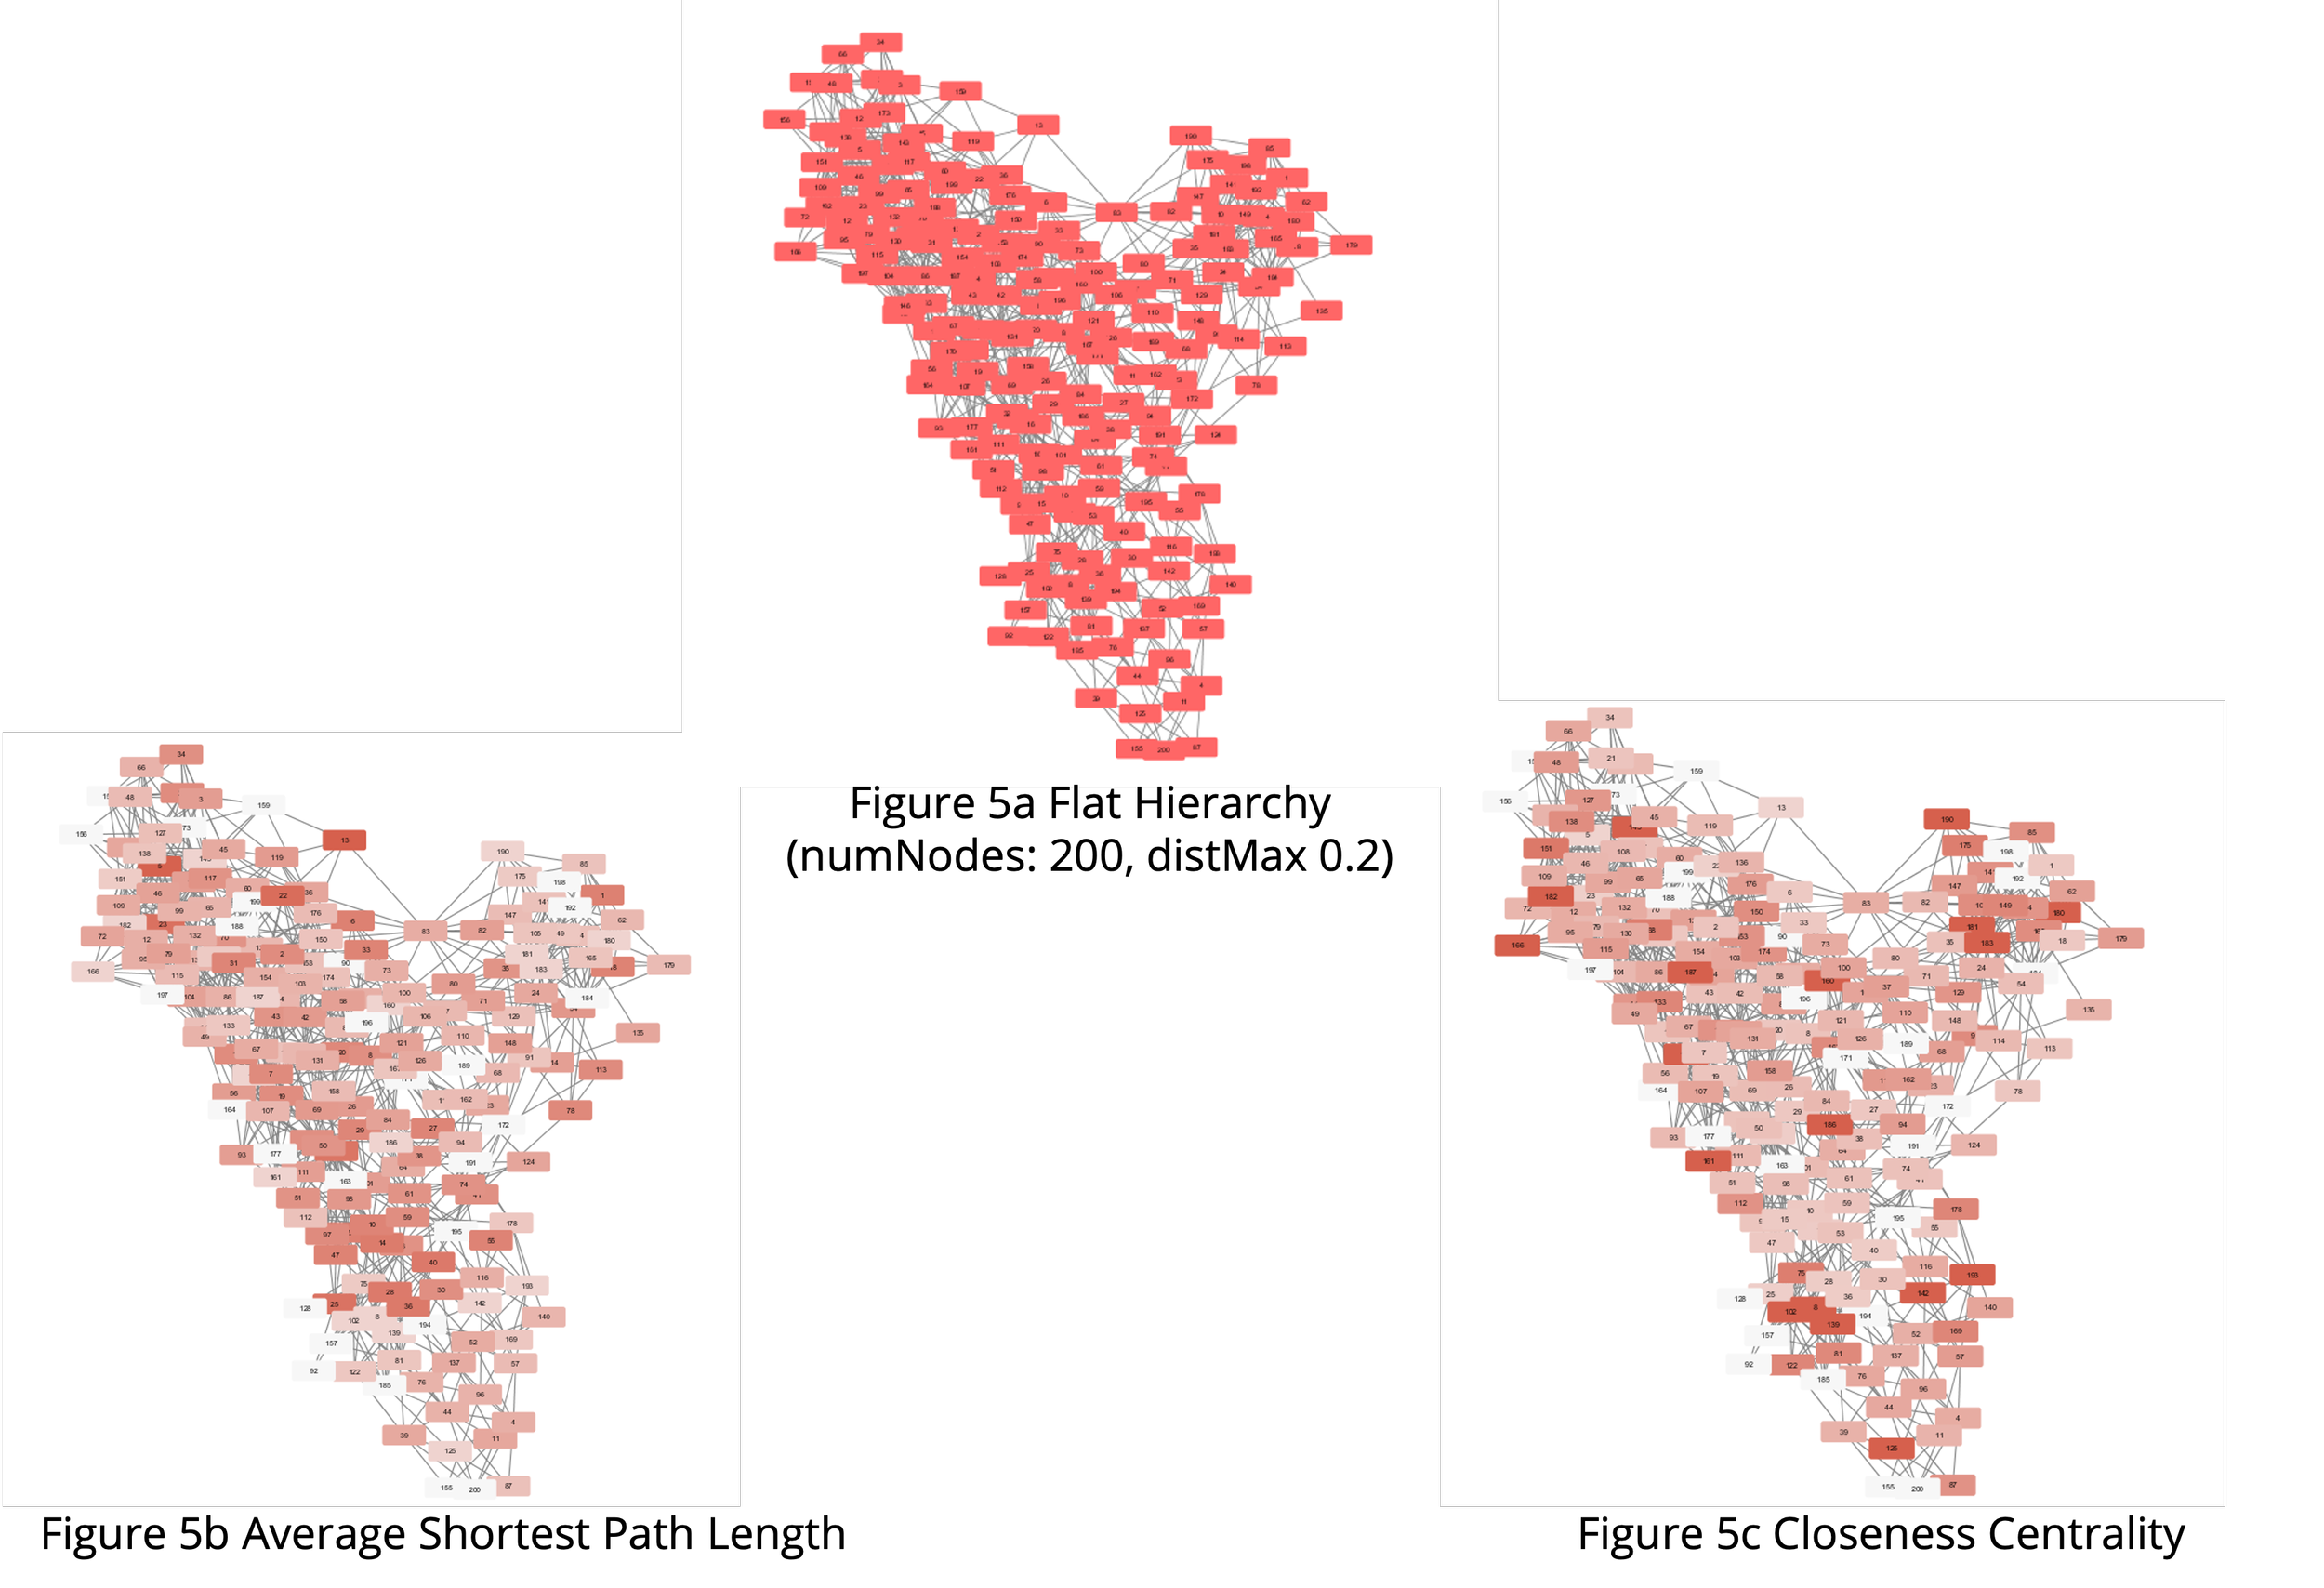
Average Shortest Path Length: Represents the average number of steps along the shortest paths for all possible pairs of network nodes
Closeness Centrality: Represents how close a node is to all other nodes
level: The number of boss-subordinate generations that exist within the network
maxboss2sub: Maximum number of subordinates allowed per boss
minboss2sub: Minimum number of subordinates allowed per boss
pflat: Probability of two-parent nodes being connected
numNodes: Maximum number of nodes allowed when randomizing flat network size
distMax: Maximum distance between two nodes under which they may be connected
fprob: Probability that a flat team must be introduced at a node
Types of Hierarchy
Flat Hierarchy

Network Interpretation
The traditional model of hierarchy models a linear structure and human resources are added proportionally to in the increase in workload. Critically, communication and ideation flow from the top to bottom, and the feedback mechanism is poor and unregulated. Subject matter experts label this type of hierarchy with a high risk of bureaucracy and sluggishness. The hierarchical organization struggles to offer constant learning and facilitate continuous growth by making employees feel heard and valued - it is rather hard to achieve in this setting and attracting and retaining top talent is difficult. The idea behind such a strong hierarchical structure is to ideally maintain the status quo. For companies looking to innovate and grow, this is an unlikely alternative.
Method
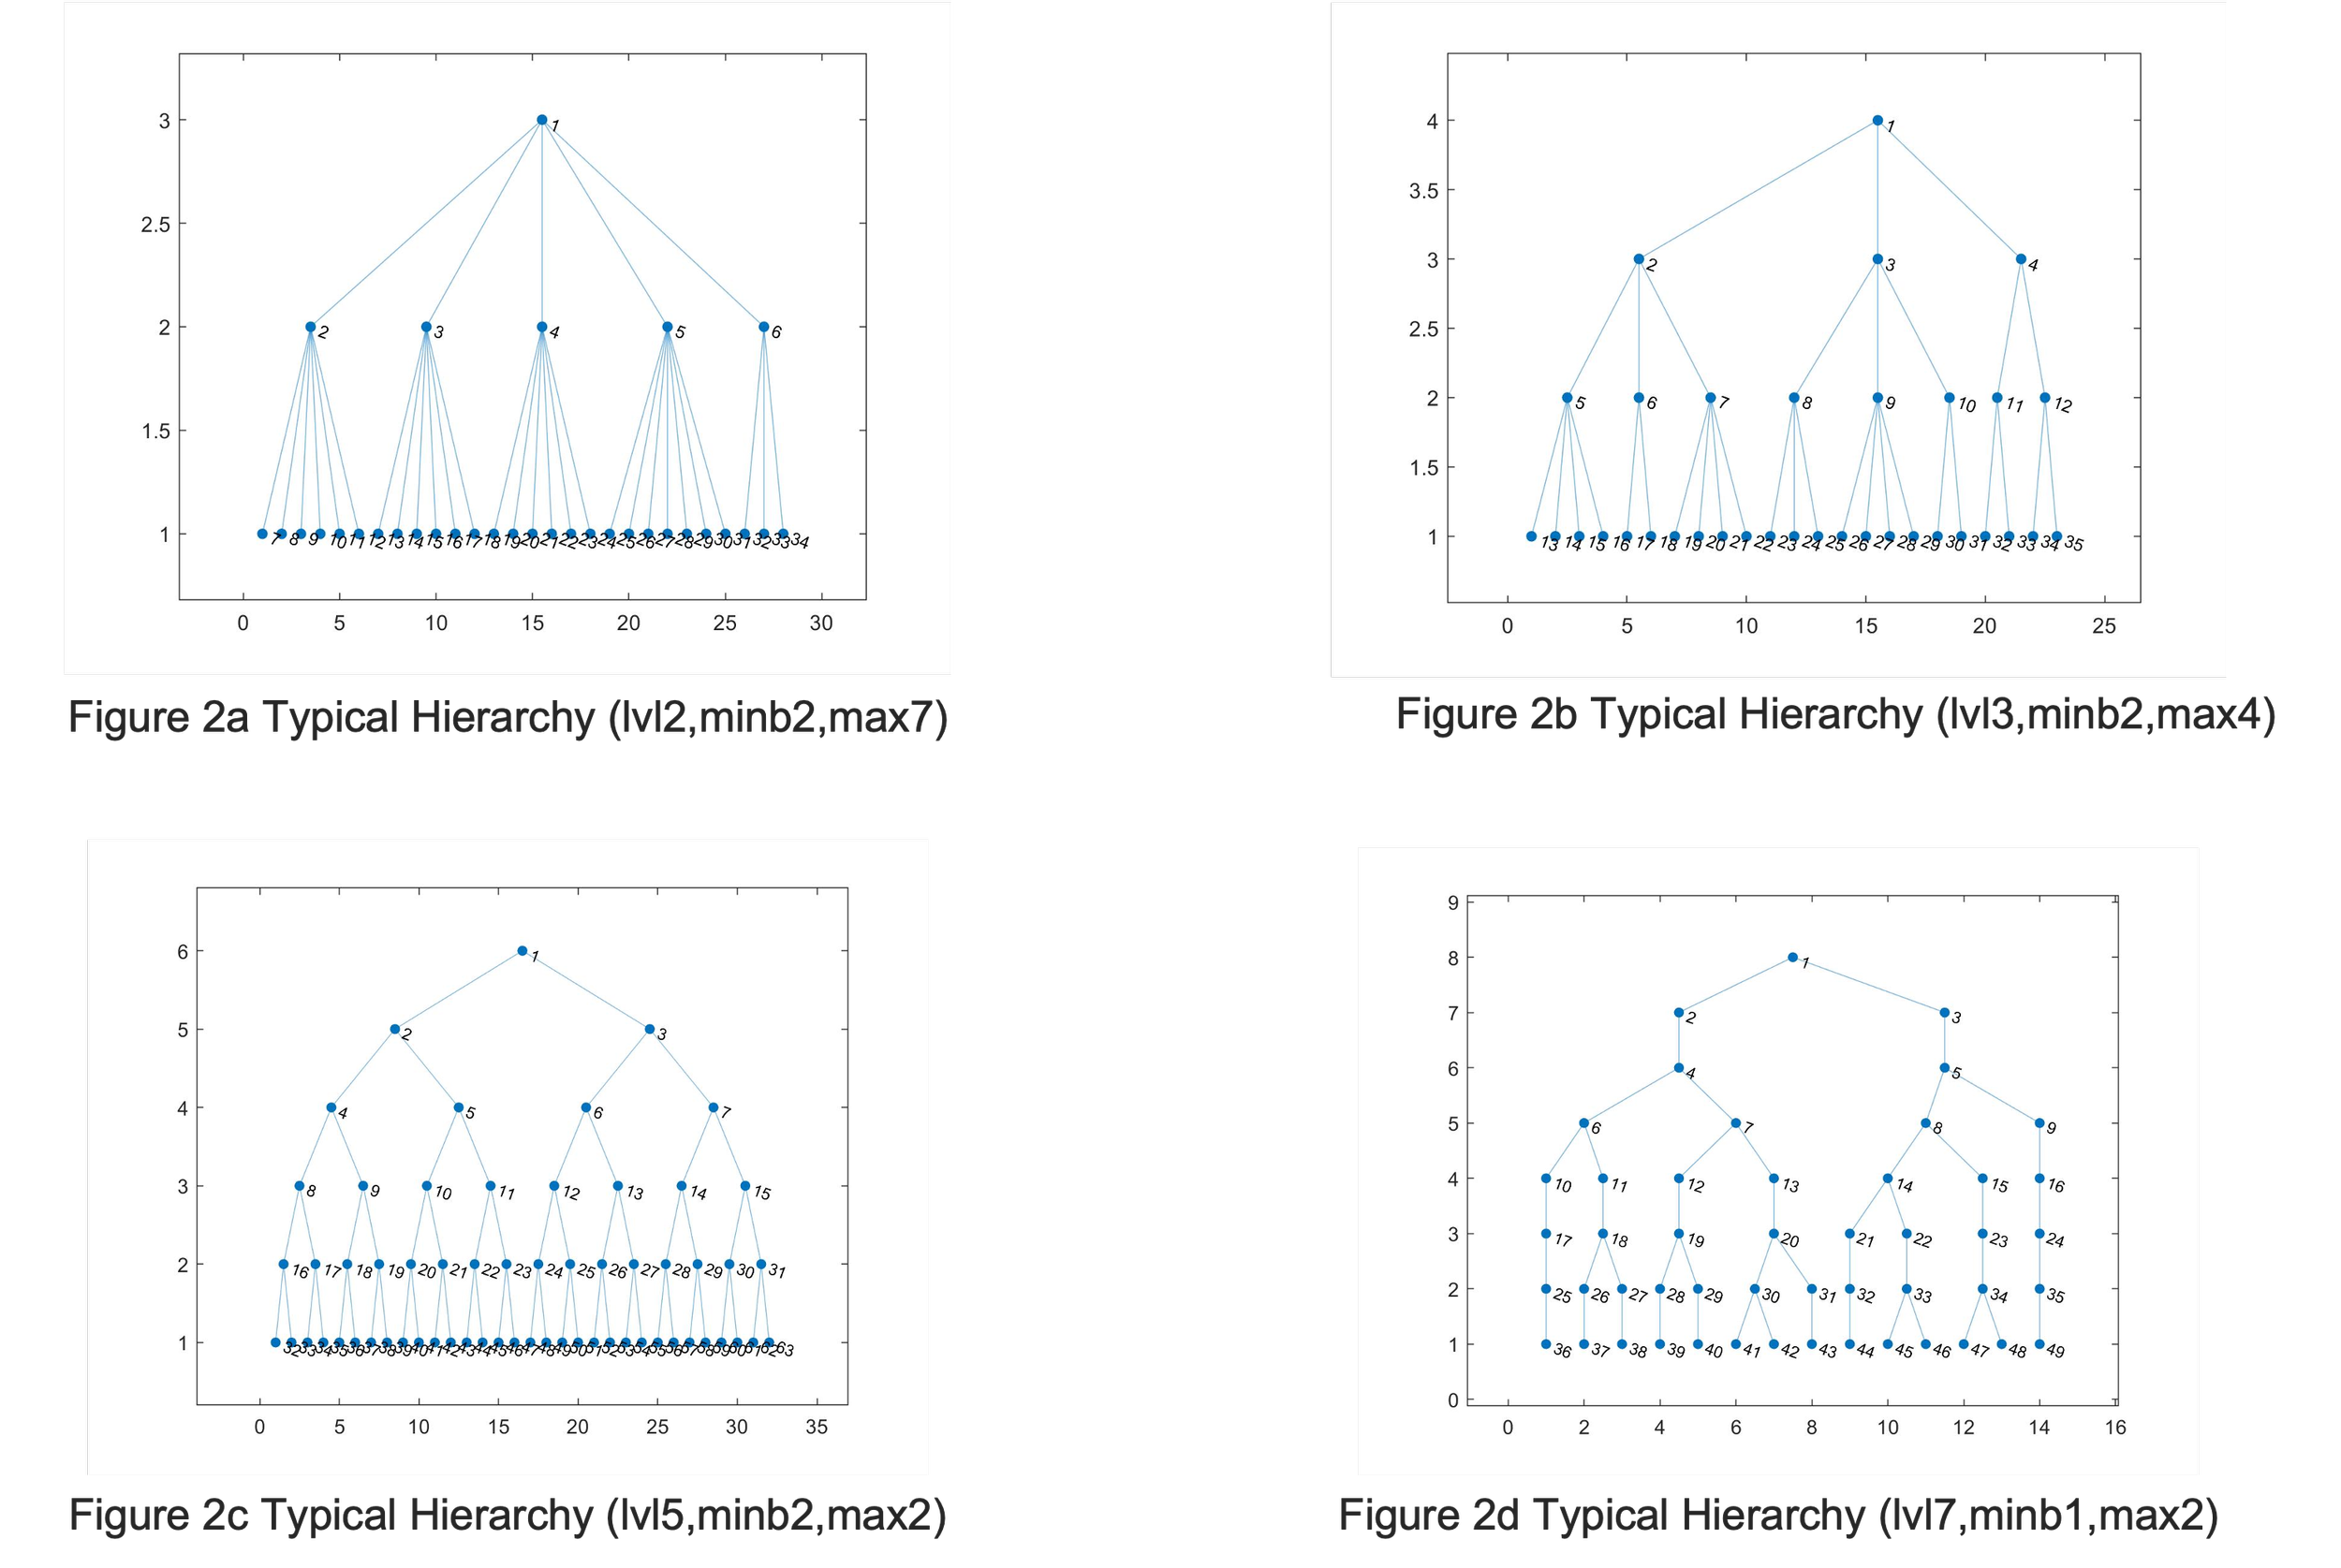
Figures 1a through 1c were generated using the Cytoscape software and 2a through 2d were generated using the Matlab software. The generative models depict various iterations of typical hierarchies seen in organizations. The models created in Cytoscape model a typical hierarchy (fig 1a), represent the average number of steps along the shortest paths for all possible pairs of network nodes (fig. 1b) and represent how close a node is to all other nodes (fig 1c). The generative model built in Matlab was created by iterating a randomized process of creating child nodes for the original parent node and subsequently repeating the process to create multiple generations of the node family, chosen by the levels parameter. The randomized child nodes were controlled within a minimum and maximum scale (minboss2sub & maxboss2sub) accepted via input parameters along with levels from the user.
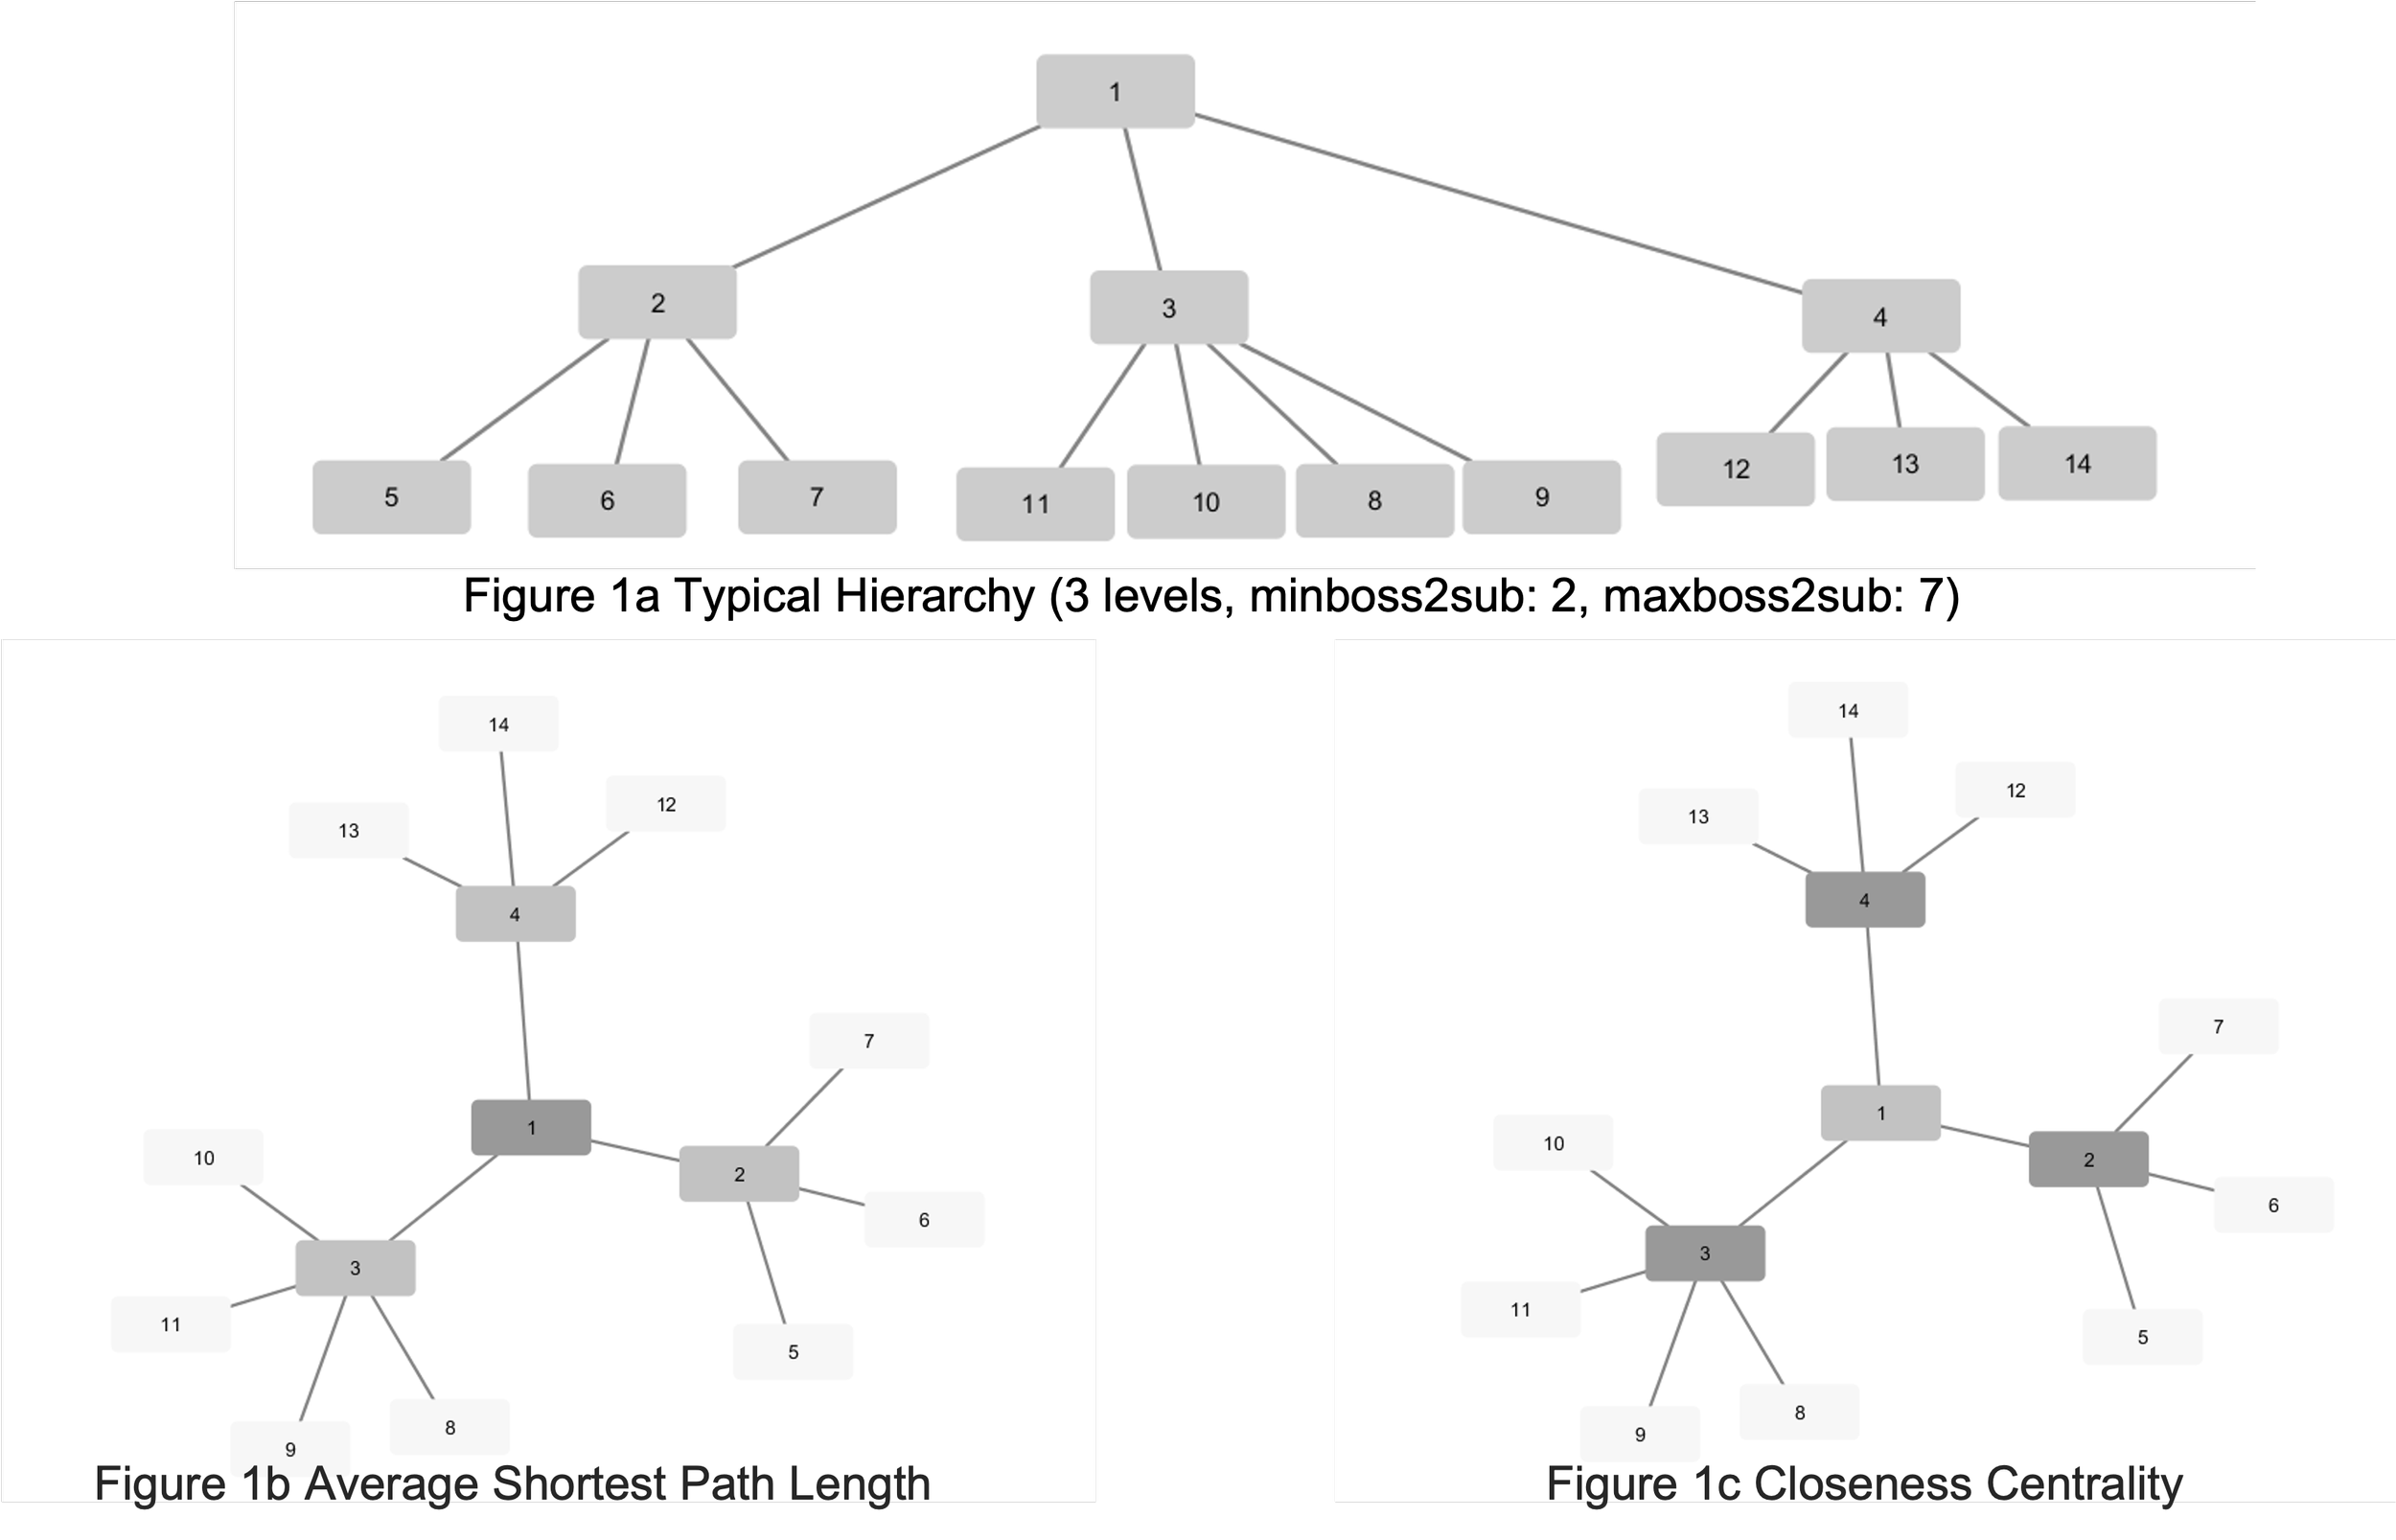
Cytoscape Representations of Typical Hierarchy
Matlab Representations of Typical Hierarchy
Network Interpretation
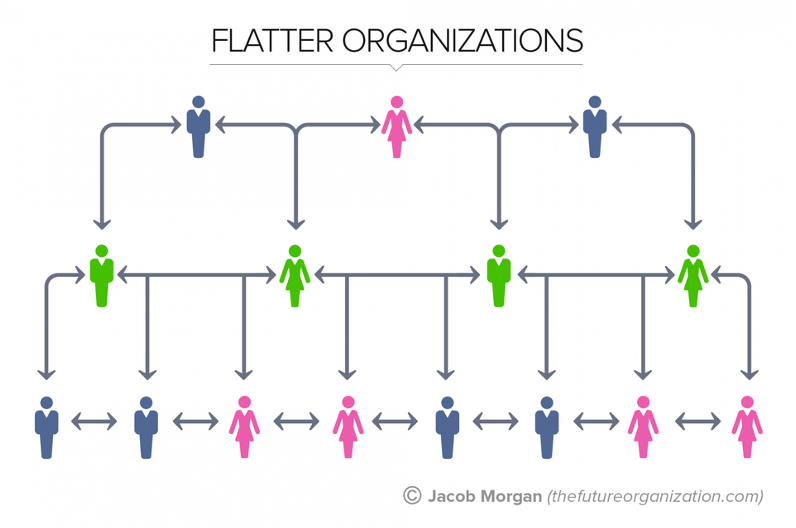
The comparatively flatter hierarchy structure as opposed to typical hierarchy focuses on increasing the upstream flow of communication and collaboration while trying to reduce the silo structure within the organization. As is seen in the representation on the left, a flatter hierarchy encourages communication between individuals from different levels and even within the same level of power. Unlike the typical hierarchy, it does not force all communication downstream. The advantage of such a structure is that while the organization may not completely revamp its workflow, they achieve better results through a quick implementation. From an organizational perspective, this setup allows for even higher collaboration at the lower levels, where it is needed the most - typically due to the relatively low experience of employees.
Method
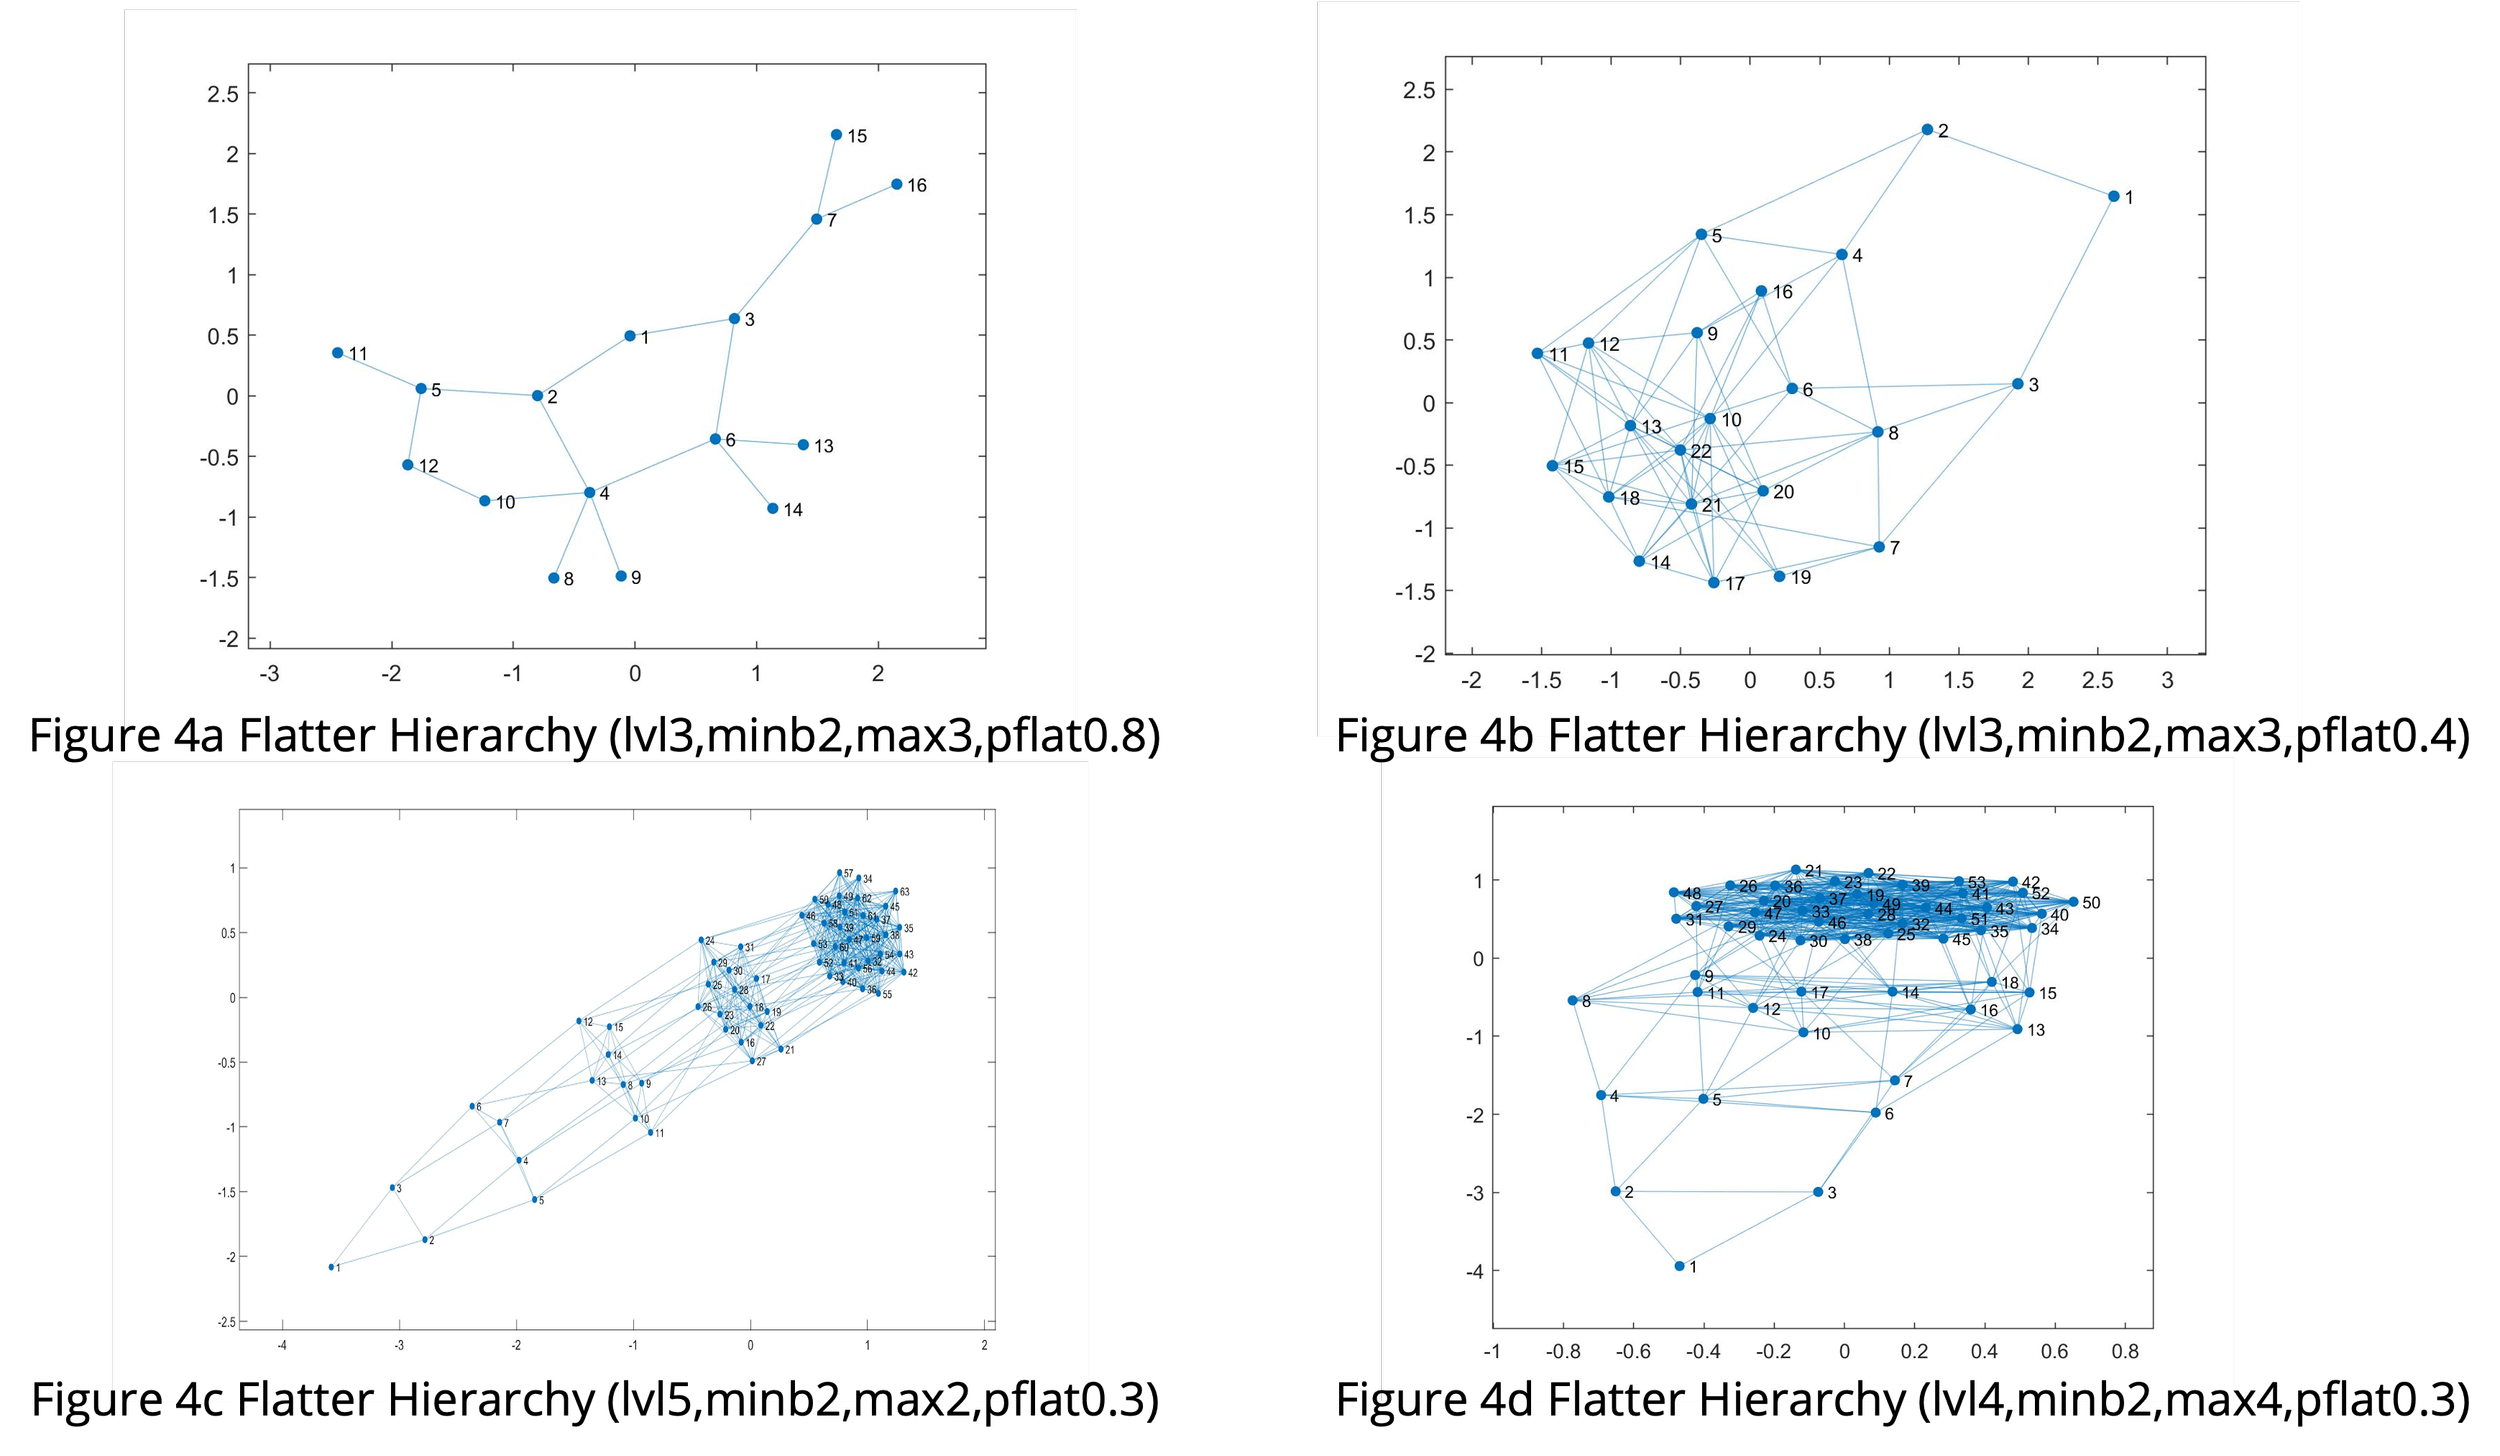
In Figures 3a through 4d generative models examples of the flatter hierarchy are represented. The main feature that distinguishes this model from a typical hierarchy is that there exists a predefined pflat probability that proportionately determines where two nodes will be connected on the same level to exchange information beyond their silo, depicting the idea of collaboration in such organizations. Visually, it can be noticed that collaboration increases as more nodes exist on the same level, comparing fig. 4a through fig. 4d; it is observed that in fig. 4a while the pflat is relatively high at 0.8 ‘collaboration’ at the same level is hard to visualize whereas in fig. 4c or fig. 4d the clusters on the same level can be perceived as having higher levels of collaboration. This may indicate that there is a disproportional correlation between organization size and the collaborative efforts realized
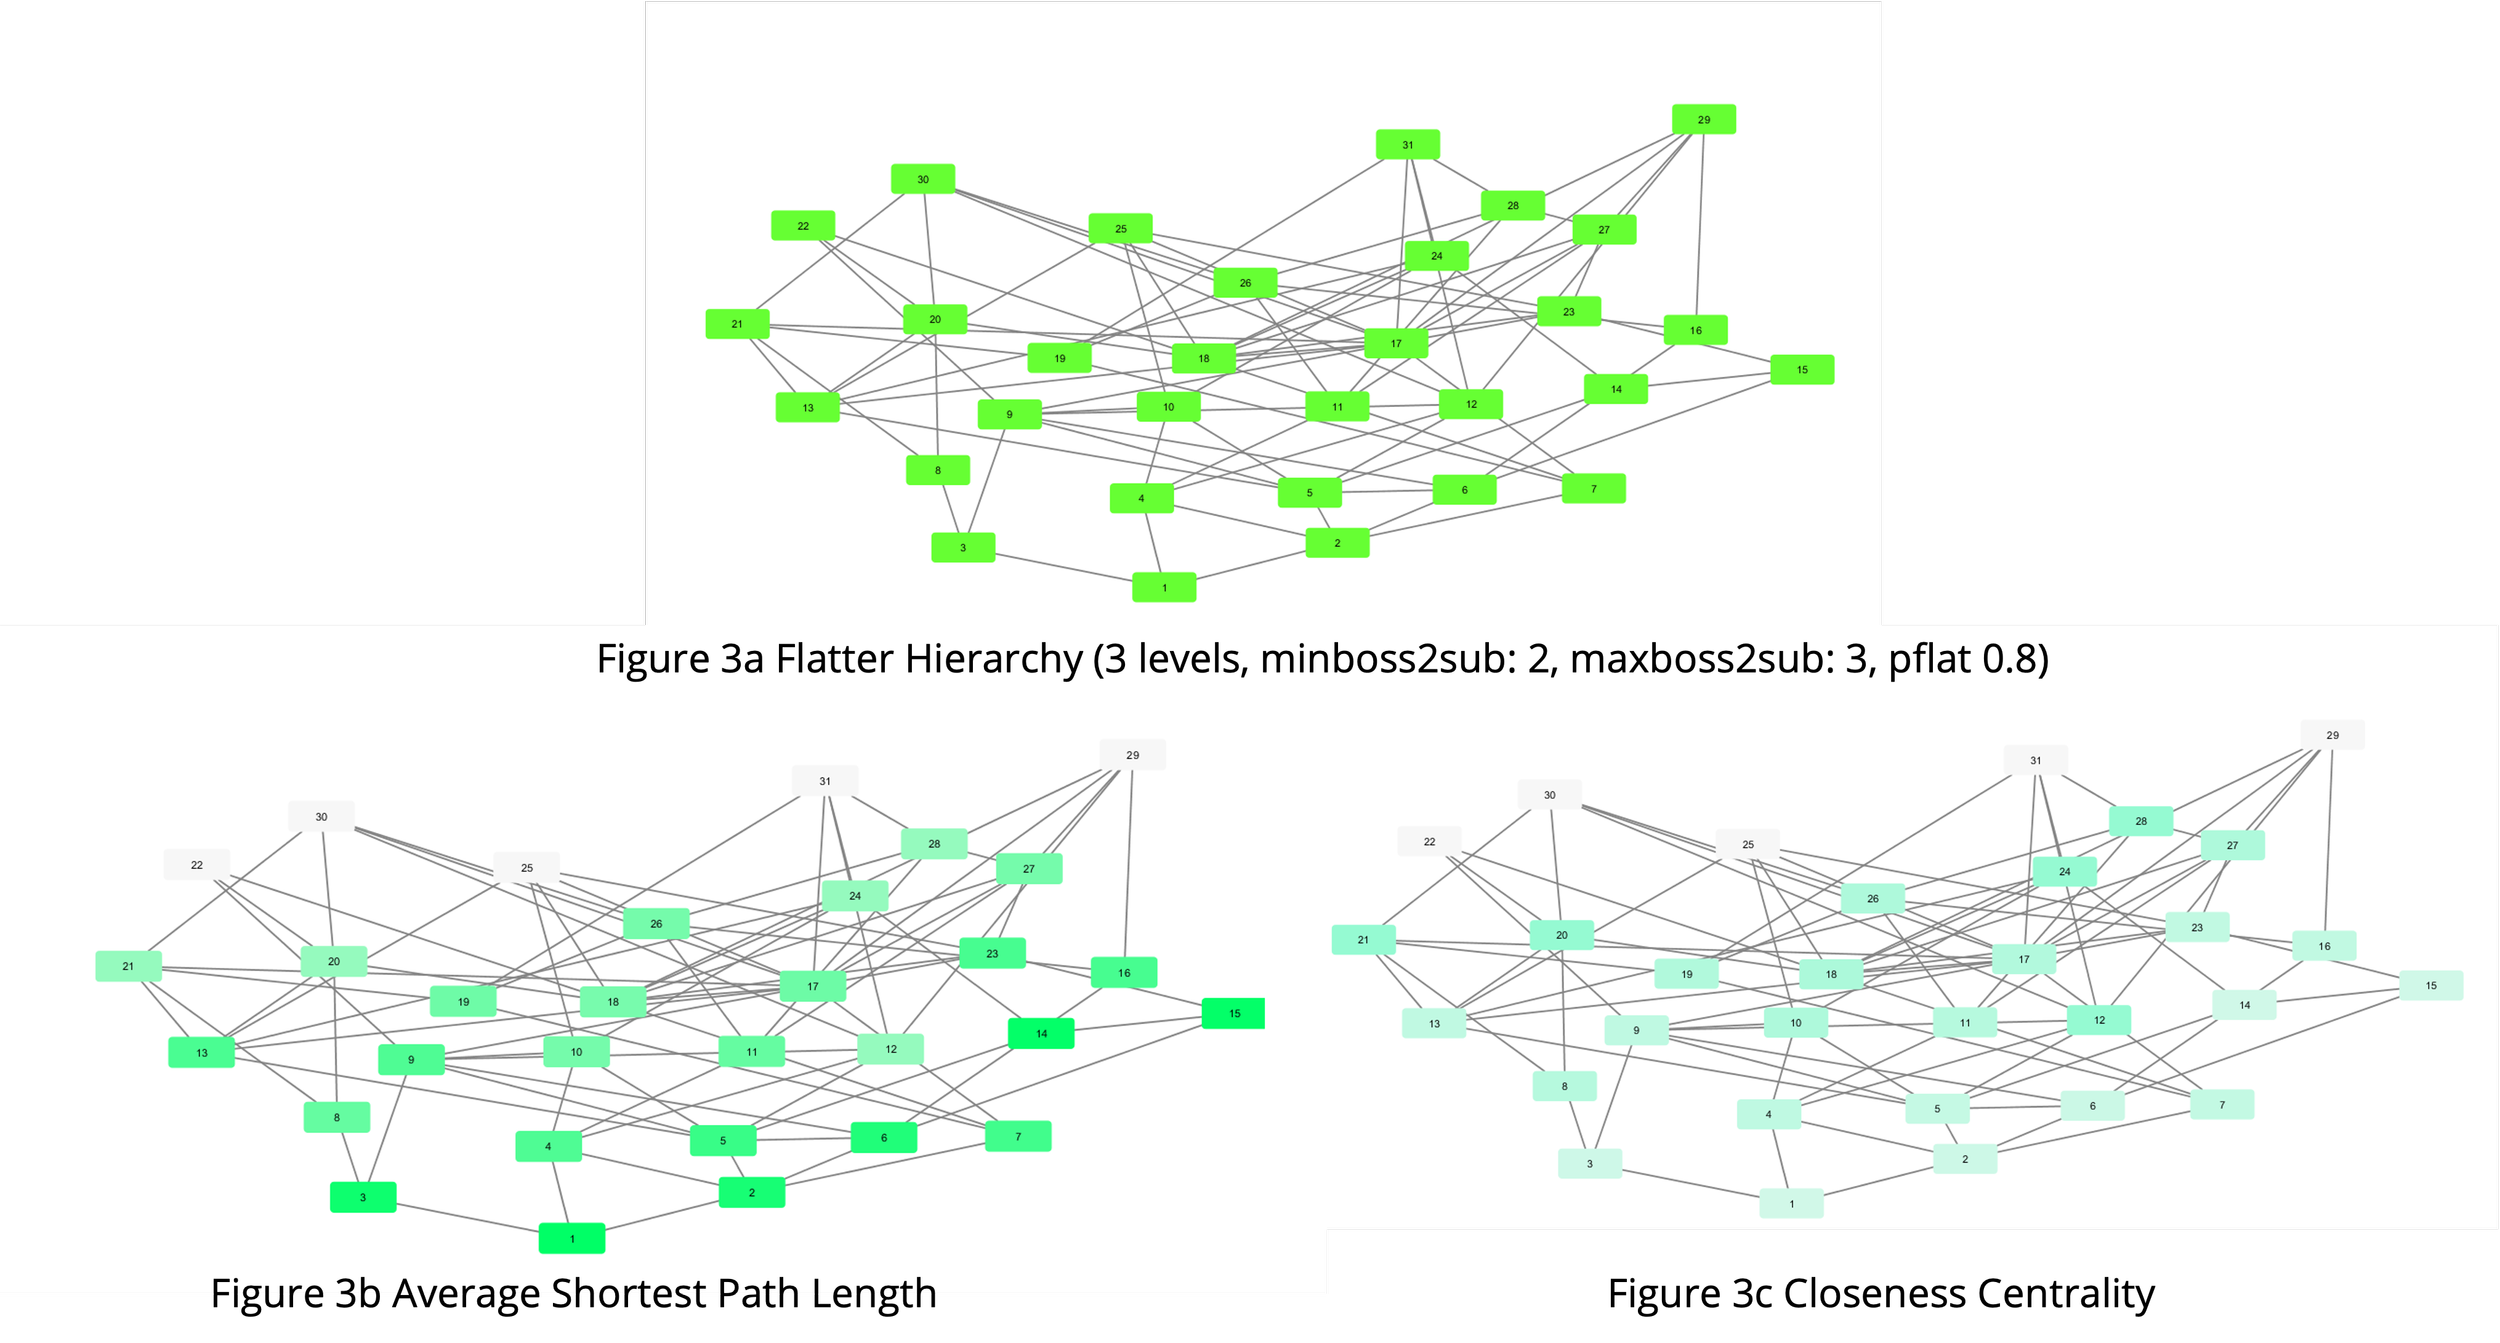
Cytoscape Representations of Flatter Hierarchy
Matlab Representations of Flatter Hierarchy
Flatter Hierarchy
Network Interpretation
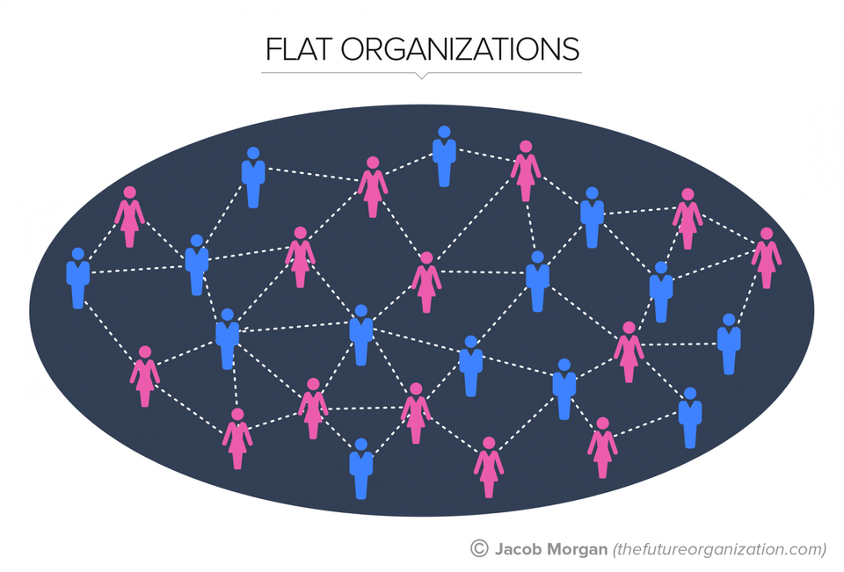
The most distinct and recent organizational structure seen in the corporate world is the flat hierarchy. Such a setup is regularly seen in small and medium-sized enterprises or more recently in start-ups that lack job titles and chain of command. While the lack of hierarchy limits to control, it may foster creativity and innovation in the nascent stages. This type of structure becomes less feasible with an increase in personnel. From a Human Resources perspective, it is important to note that a ‘seniority-based’ hierarchy gets created automatically within the organization, and during the lack of the same such organizations place their faith in self-management techniques that are expected of their employees to function effectively.
Method
The flat hierarchy model required two parameters: numNodes and distMax. numNodes is used to define the max number of nodes possible for the random-sized matrix generated for the model. distMax sets a restriction on the node pairs that can be connected - if a certain pair is at a distance further than distMax, an edge will not be created. For the sake of directionality, a randomized function decides the direction of the edge. As such, an adjacency matrix with a flat structure can be achieved, as there is no preset order of node creation or connection within the algorithm.
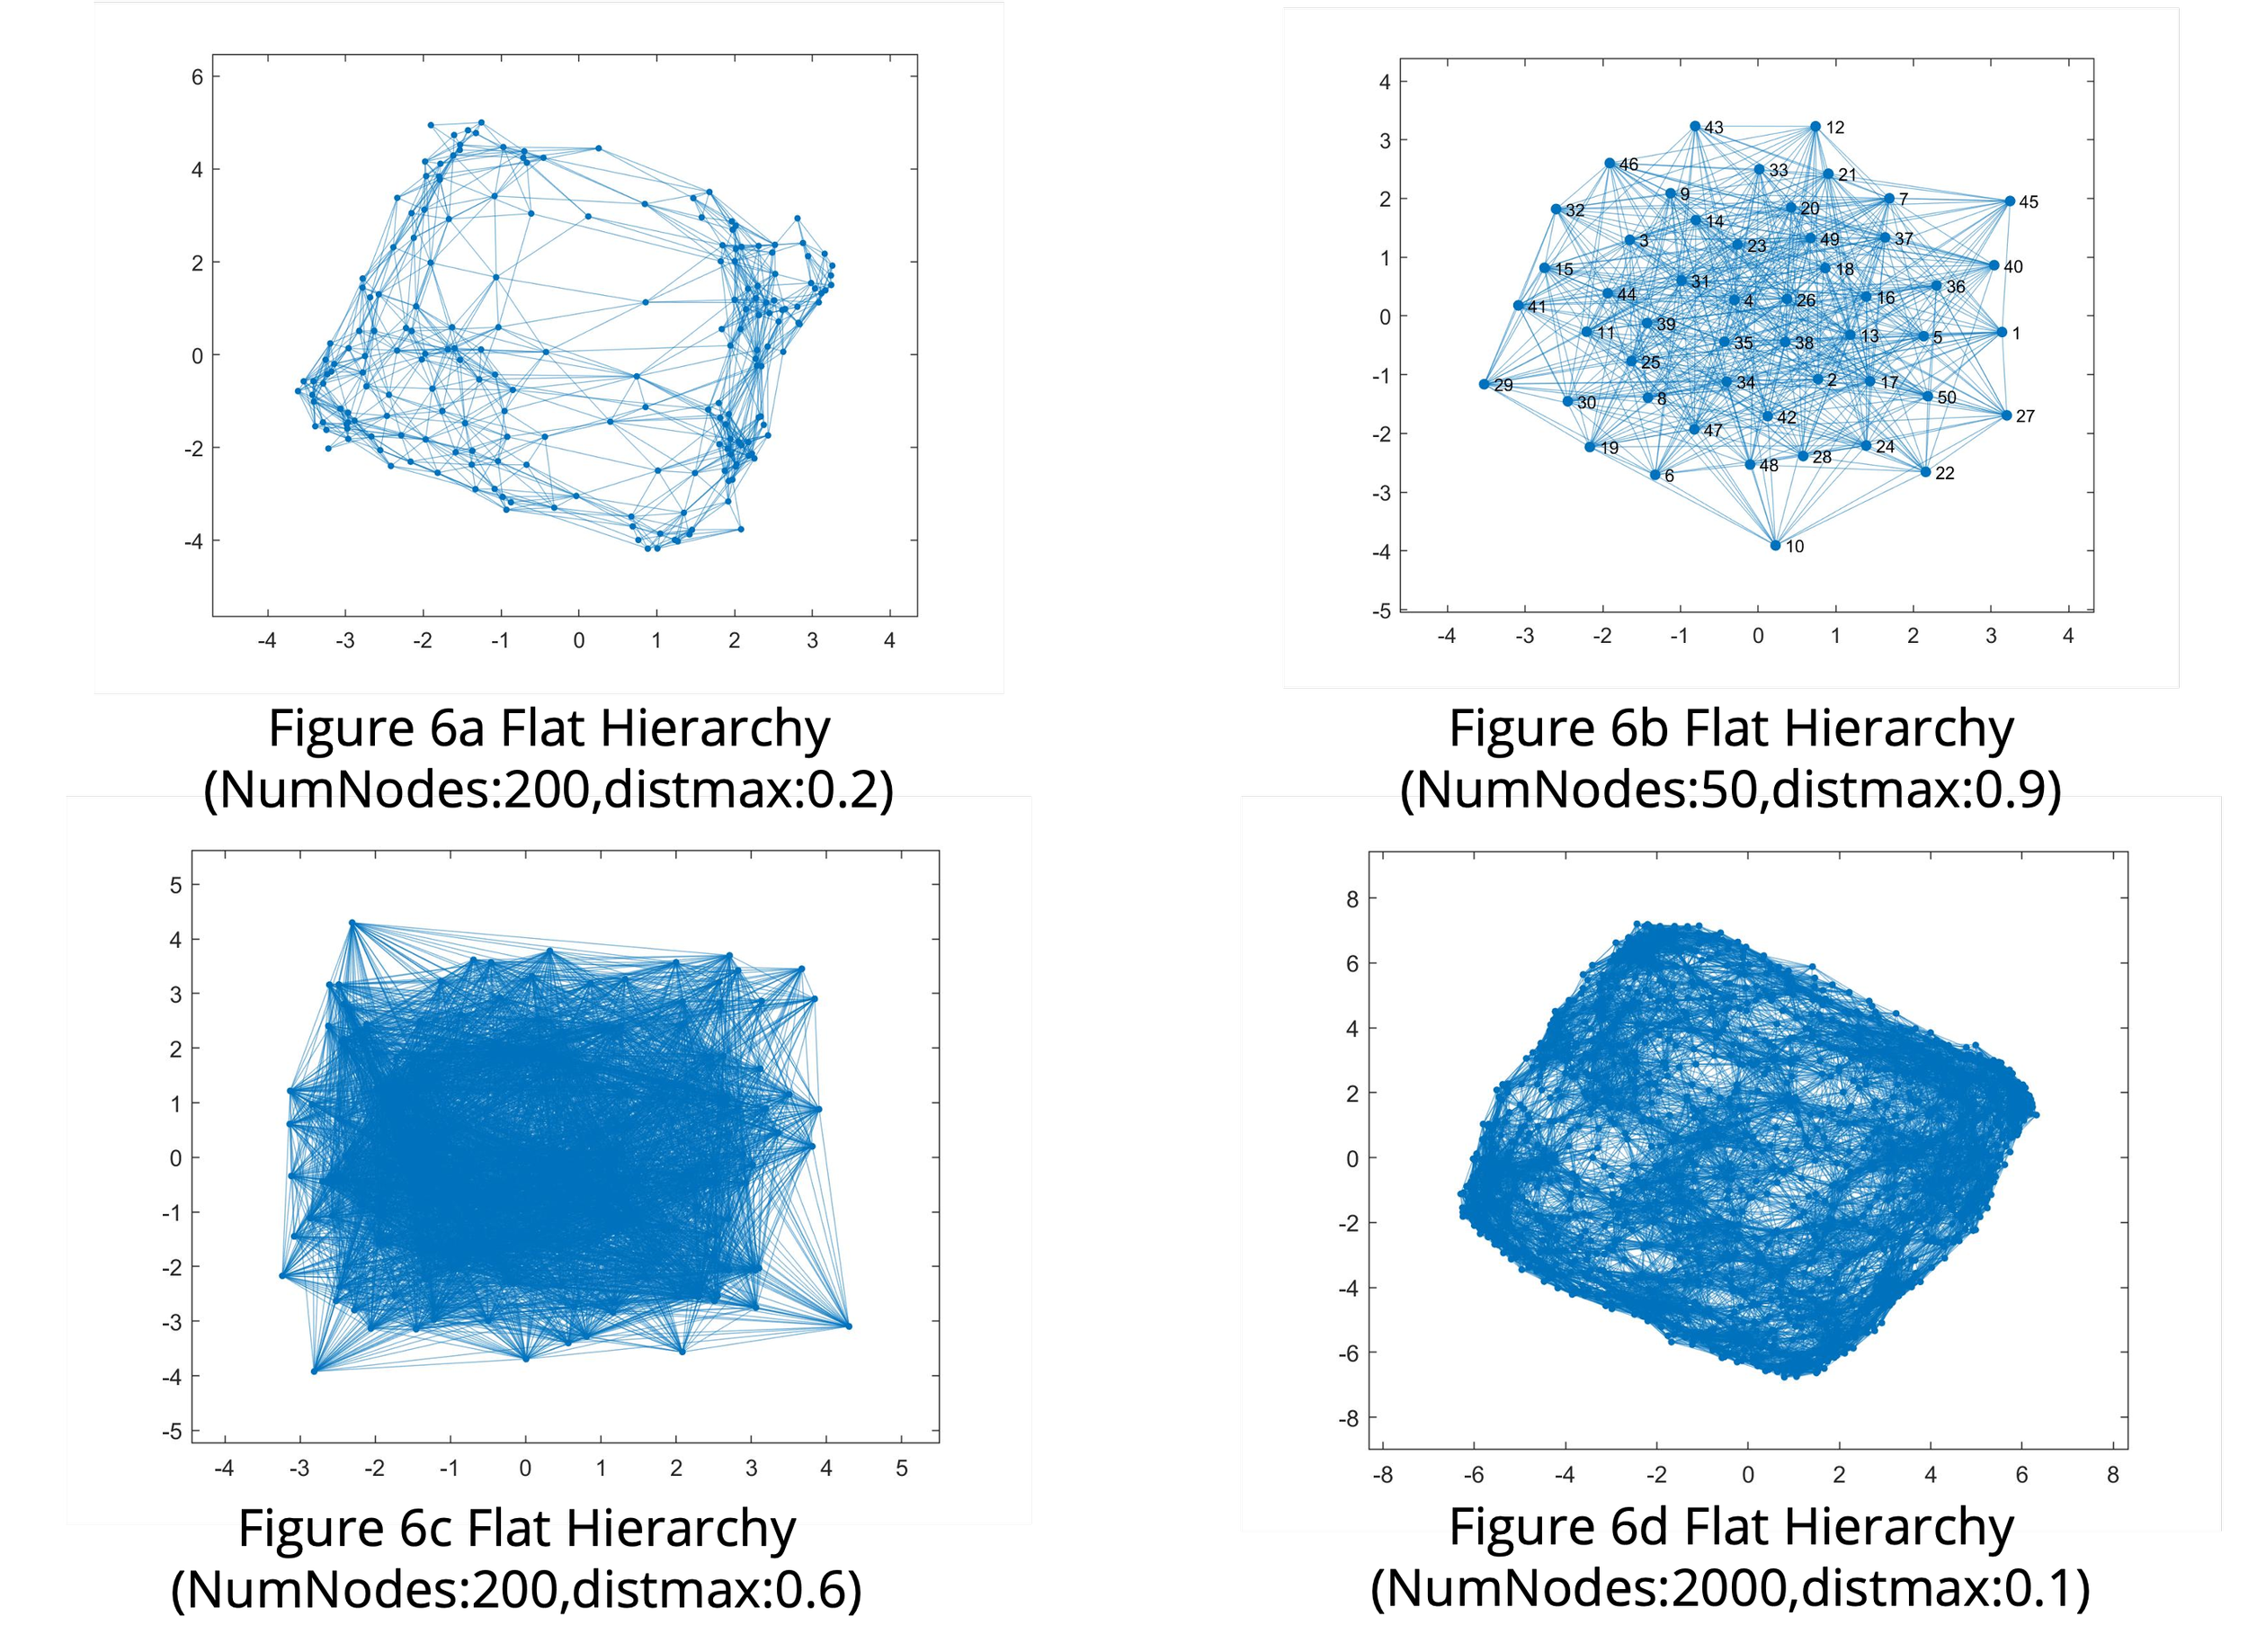
In figures 6a through 6d, the effects of numNode are disproportionate to that of distMax- it can be seen that as the number of nodes increases marginally, the edge density increases drastically despite the low limit on the maximum distance allowed between two nodes for edge creation.
Cytoscape Representations of Flat Hierarchy
Matlab Representations of Flat Hierarchy
Flat Hierarchy
Network Interpretation
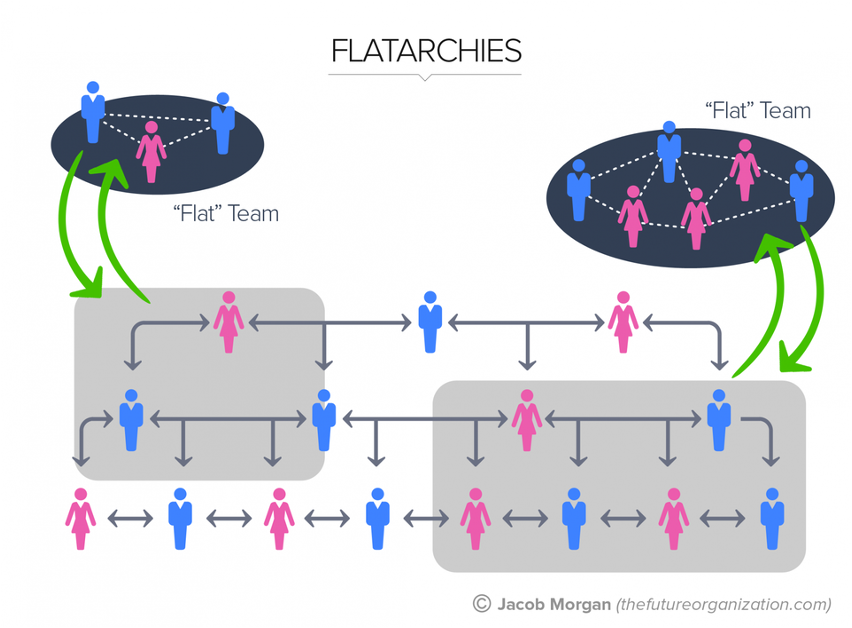
Flatarchies lie between a hierarchy and a flat organization. The dynamic structure allows organizations to adopt the stiffer chain of command offered by hierarchies or the free flow of ideas and injection of innovation within the company via the flat teams that can be created on an ad-hoc basis. Typically, organizations set up with this structure may have an emphasized hierarchical structure but operational fluidity to allow for the creation of new project teams. This model is considered to be more powerful than the ones discussed previously for the needs of the current times given its balanced approach between control and creativity.
Method
The generative model for this network was created precisely like the aforementioned description - by combining the flatter and flat hierarchy adjacency matrices. By introducing several flat structures within a flatter hierarchy, the fluid nature of a flatarchy could be successfully emulated. The parameters for a flatarchy are the same as those of its two constituents with the addition of flatprob which determines the presence of a flat team at any given know and introduces a flat structure at the affirmative condition.
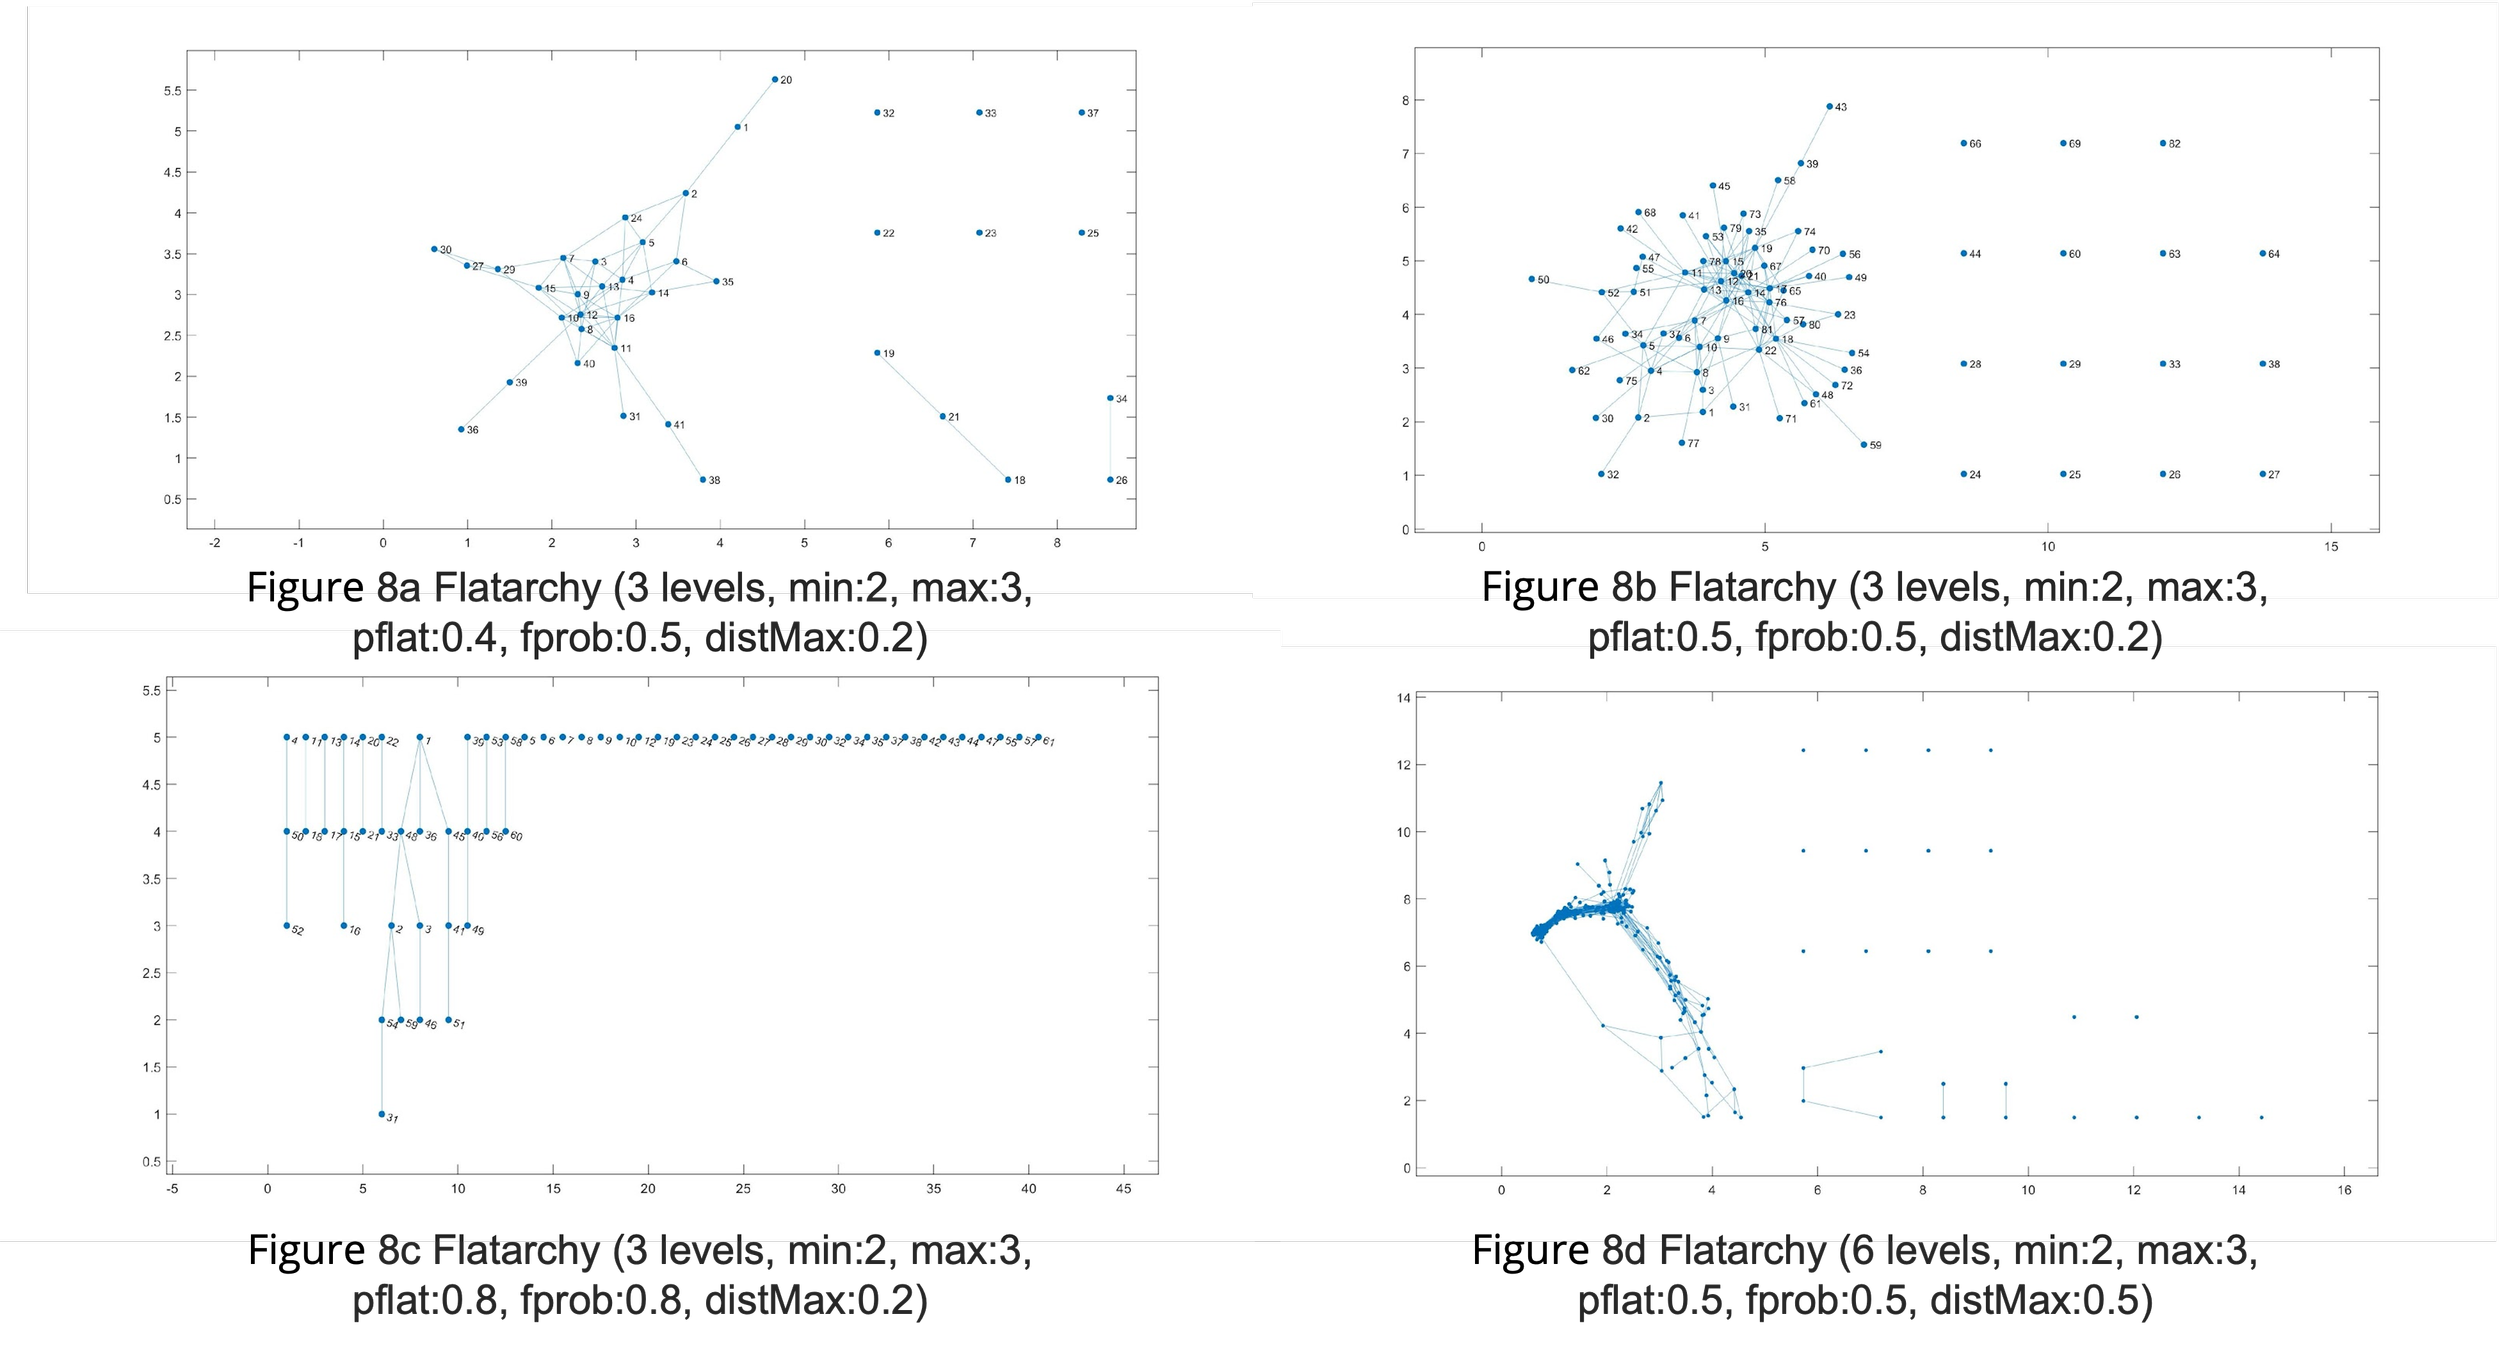
In figure 8a through figure 8d, Matlab representations of networks of varying sizes are displayed. It can be observed from figures 8b and 8c that the tendency to form a truly connected network diminishes as the value of pflat (probability of two-parent nodes being connected) and fprob (probability that a flat team must be introduced at a node) increases.
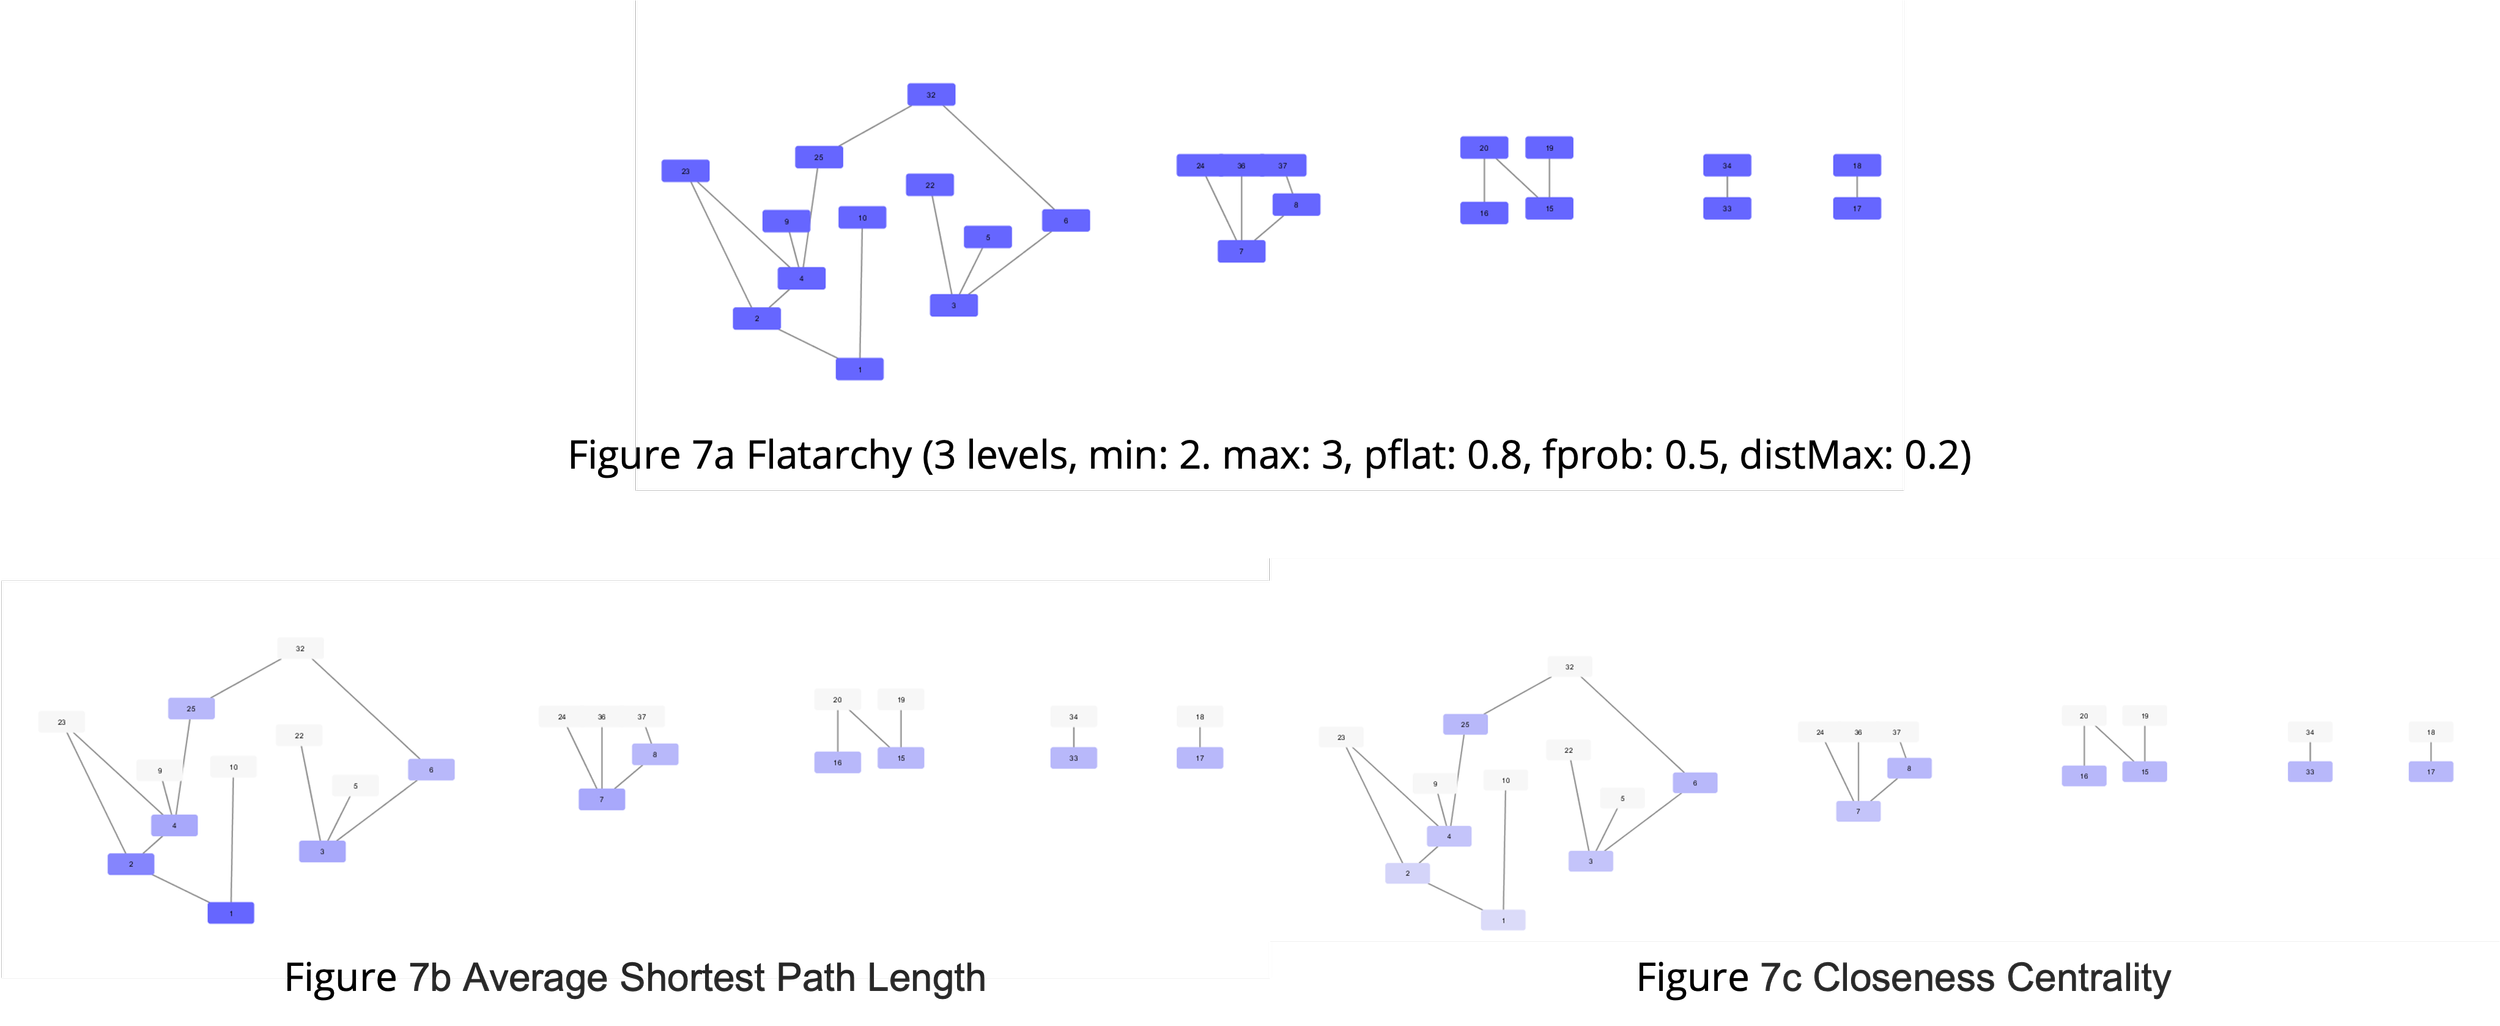
Cytoscape Representations of Flatarchy Hierarchy
Matlab Representations of Flatarchy Hierarchy
Flatarchy Hierarchy
Organization Morphospace
A theoretical morphospace was chosen to establish a mathematical model that would describe the spectrum of possible outcomes of the hierarchies defined above. Moreover, it would allow for a relative comparison of the hierarchies on selected scales, potentially helping identify the best models for a certain property. The morphospace of organizational hierarchy has been defined by three coordinates: treeness (T), feedforwardness (F), and orderability (O). Treeness weighs how pyramidal the structure is and how well defined its chain of command may be, and lies between -1<T<1. Feedforwardness is the measure that weighs the impact of cyclic modules on the feedforward structure, and is calculated such that cyclic modules at the top of the structure incur a larger penalty than those at the bottom, and varies from 0<F<1. Since hierarchy is deeply entrenched in the concept of order, Orderability is defined as the fraction of nodes of the graph that do not belong to any graph, and has values ranging from -1<O<1.
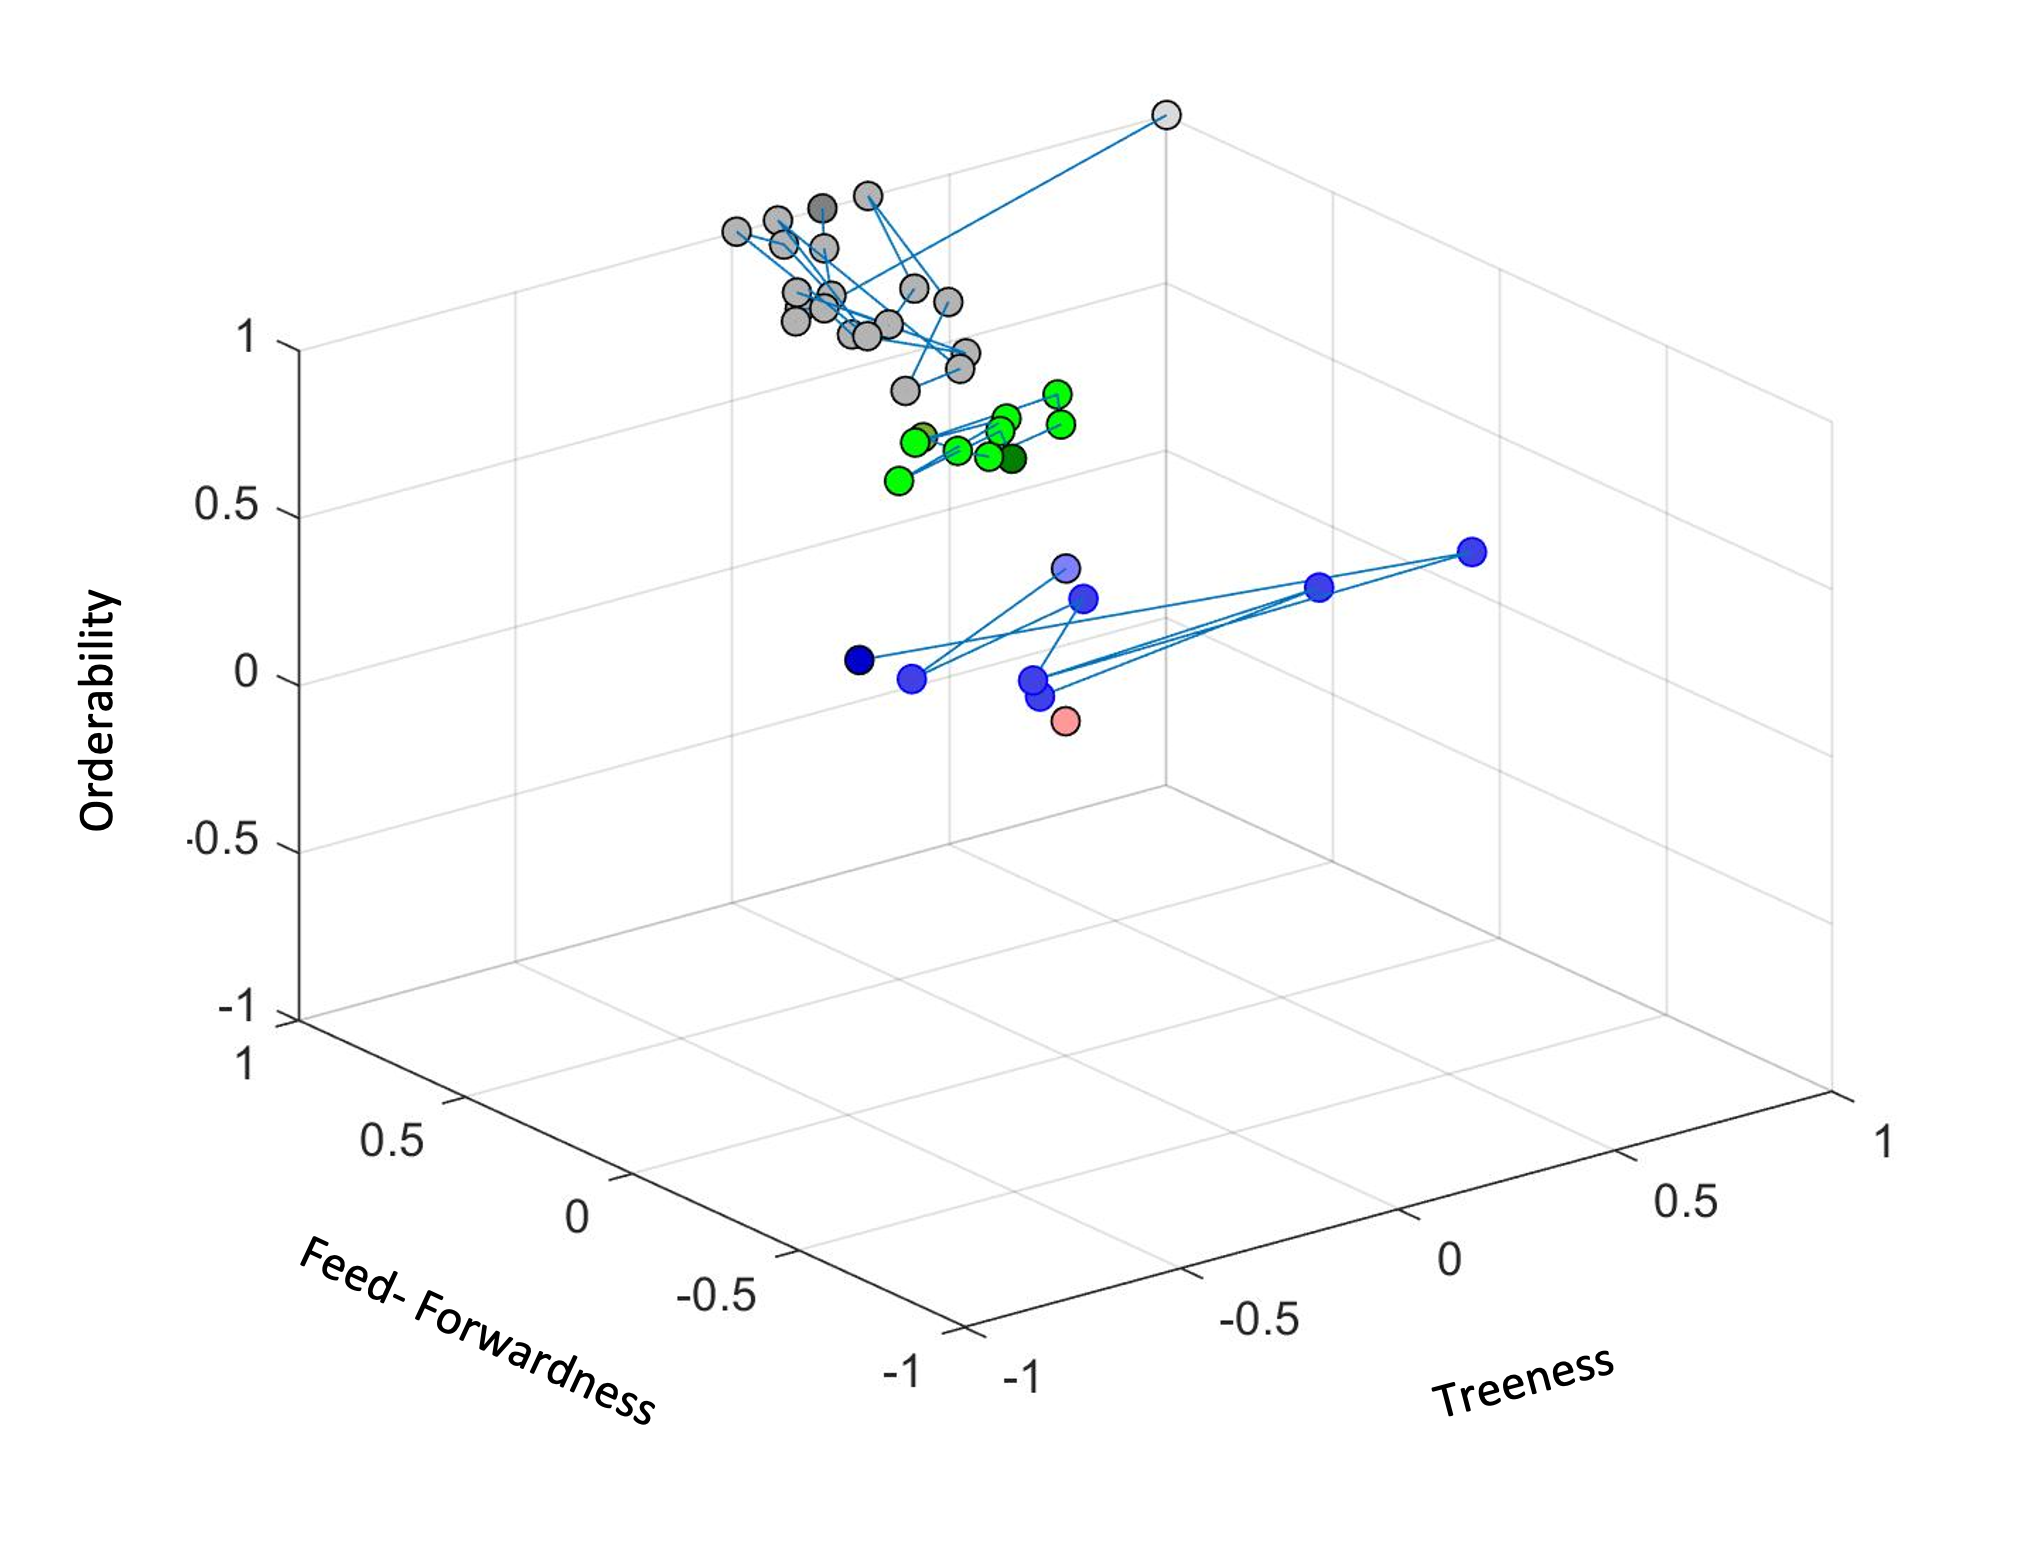
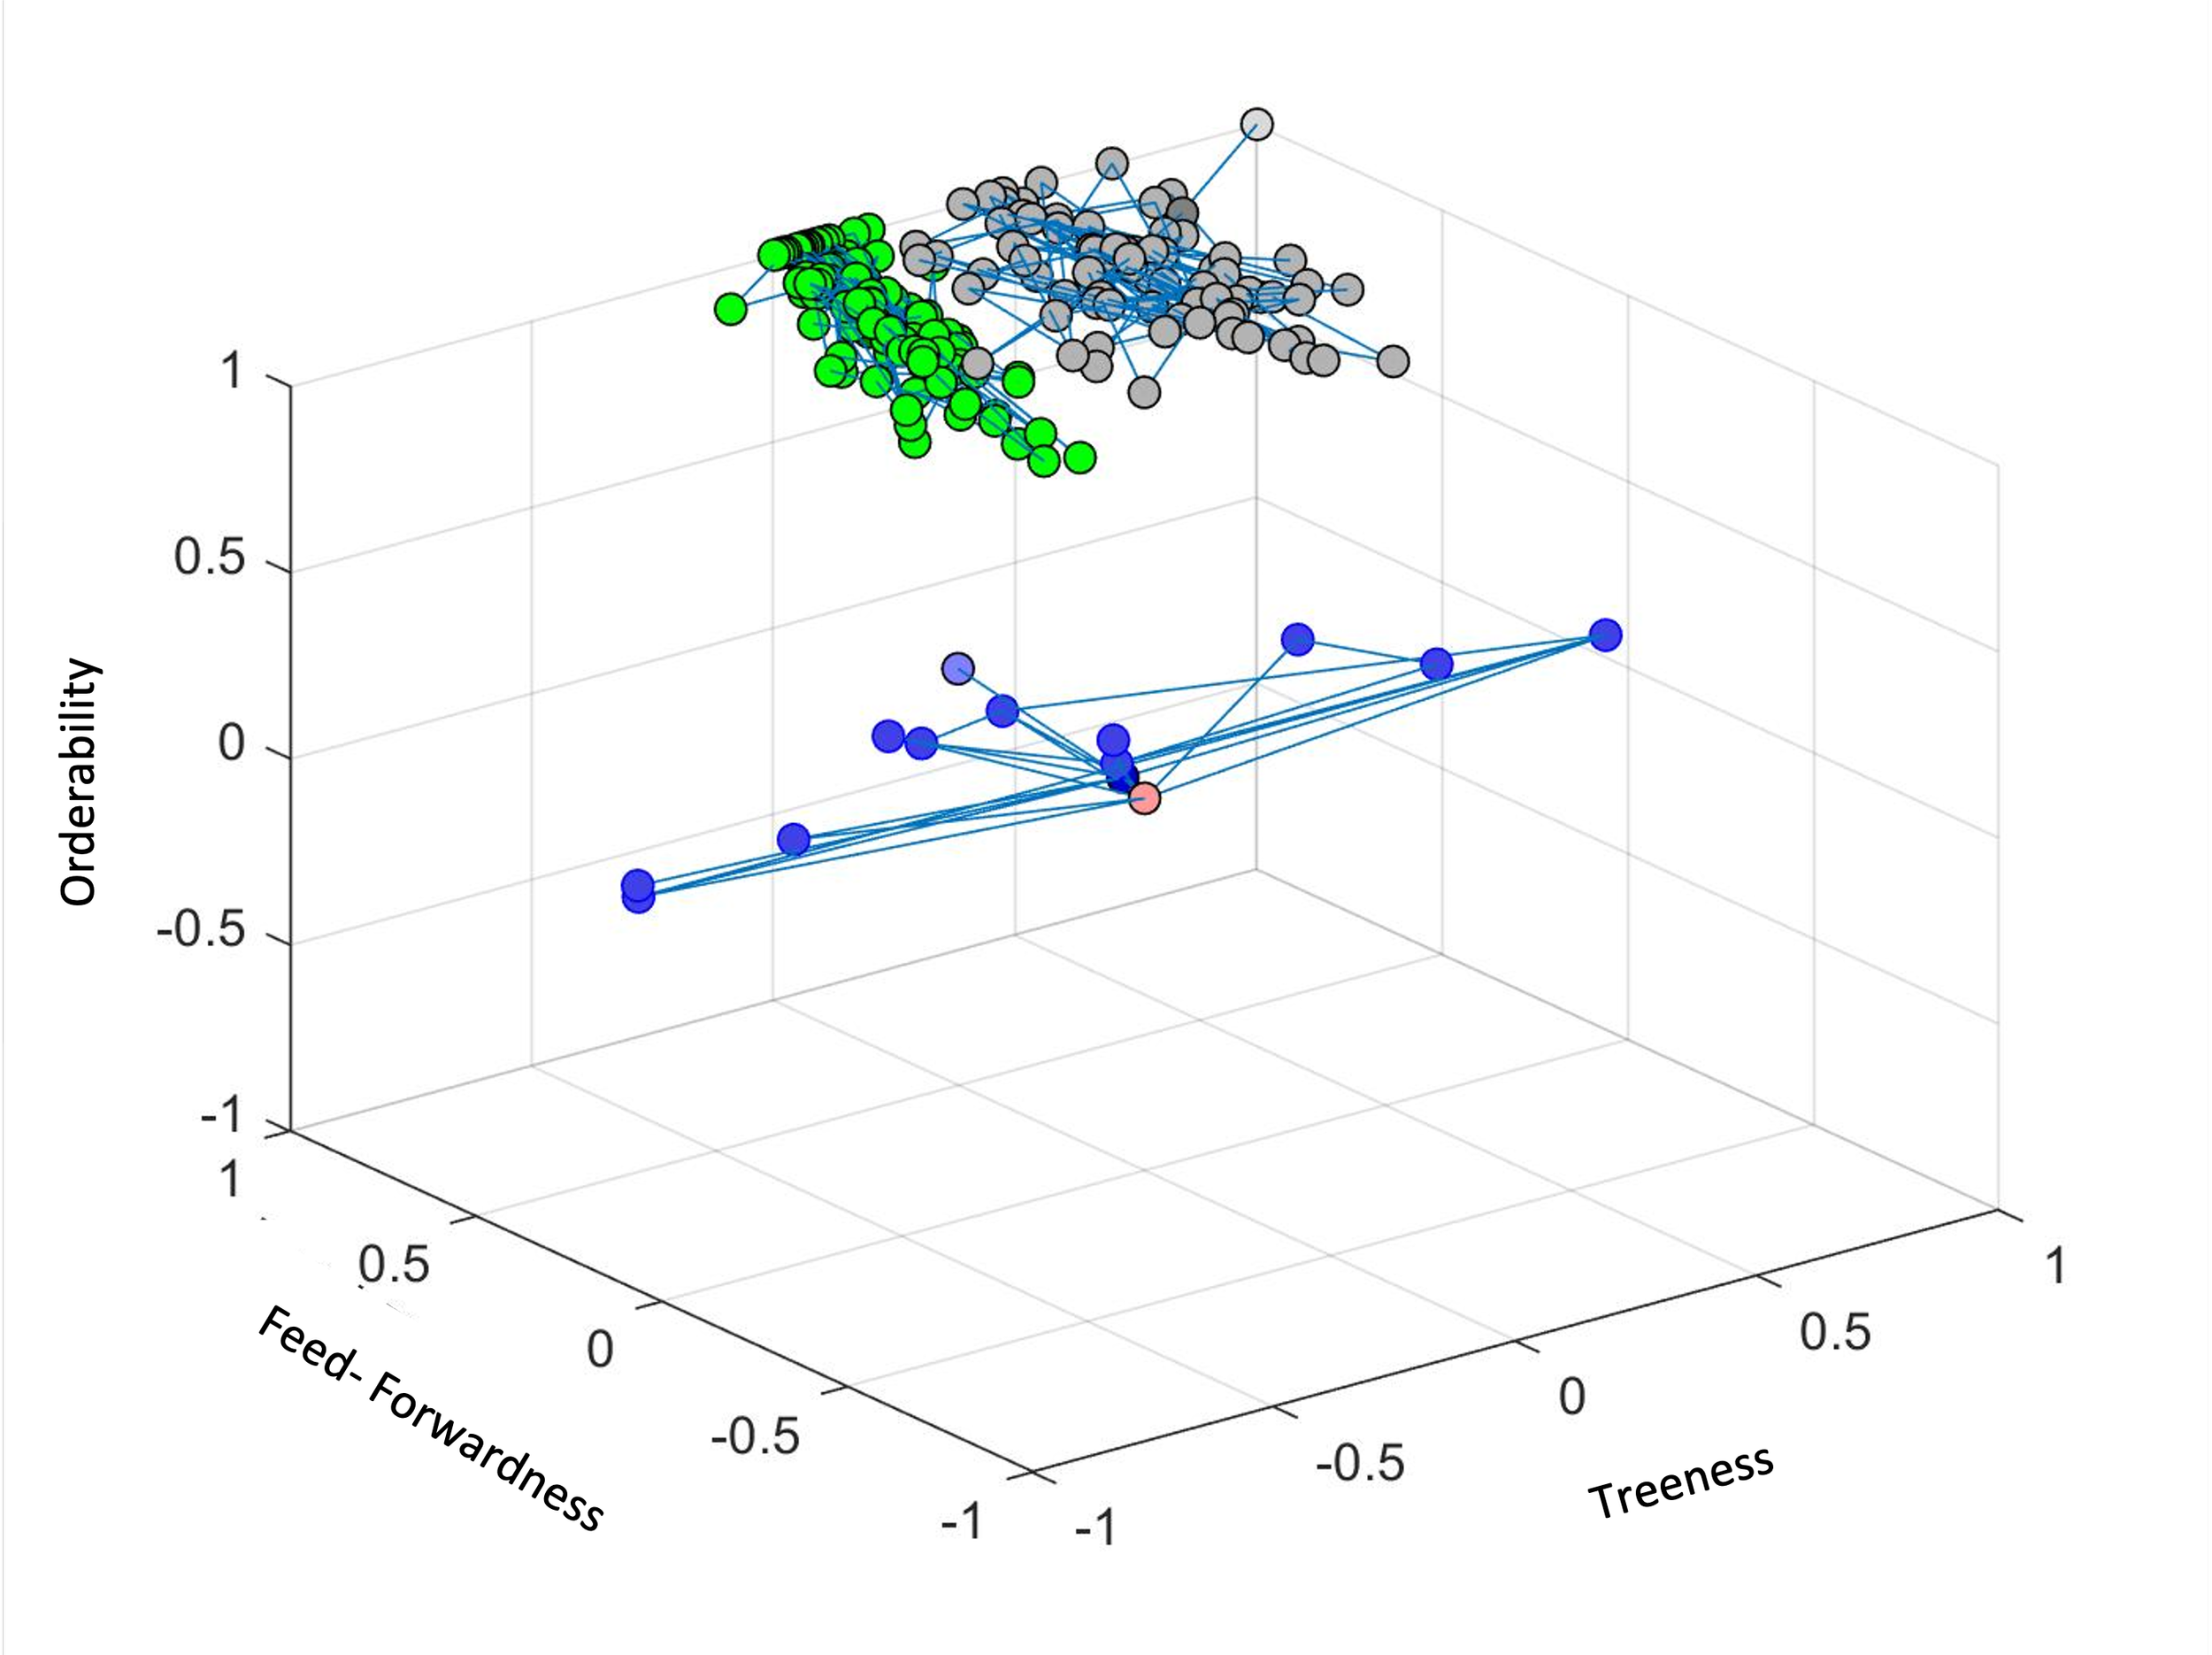
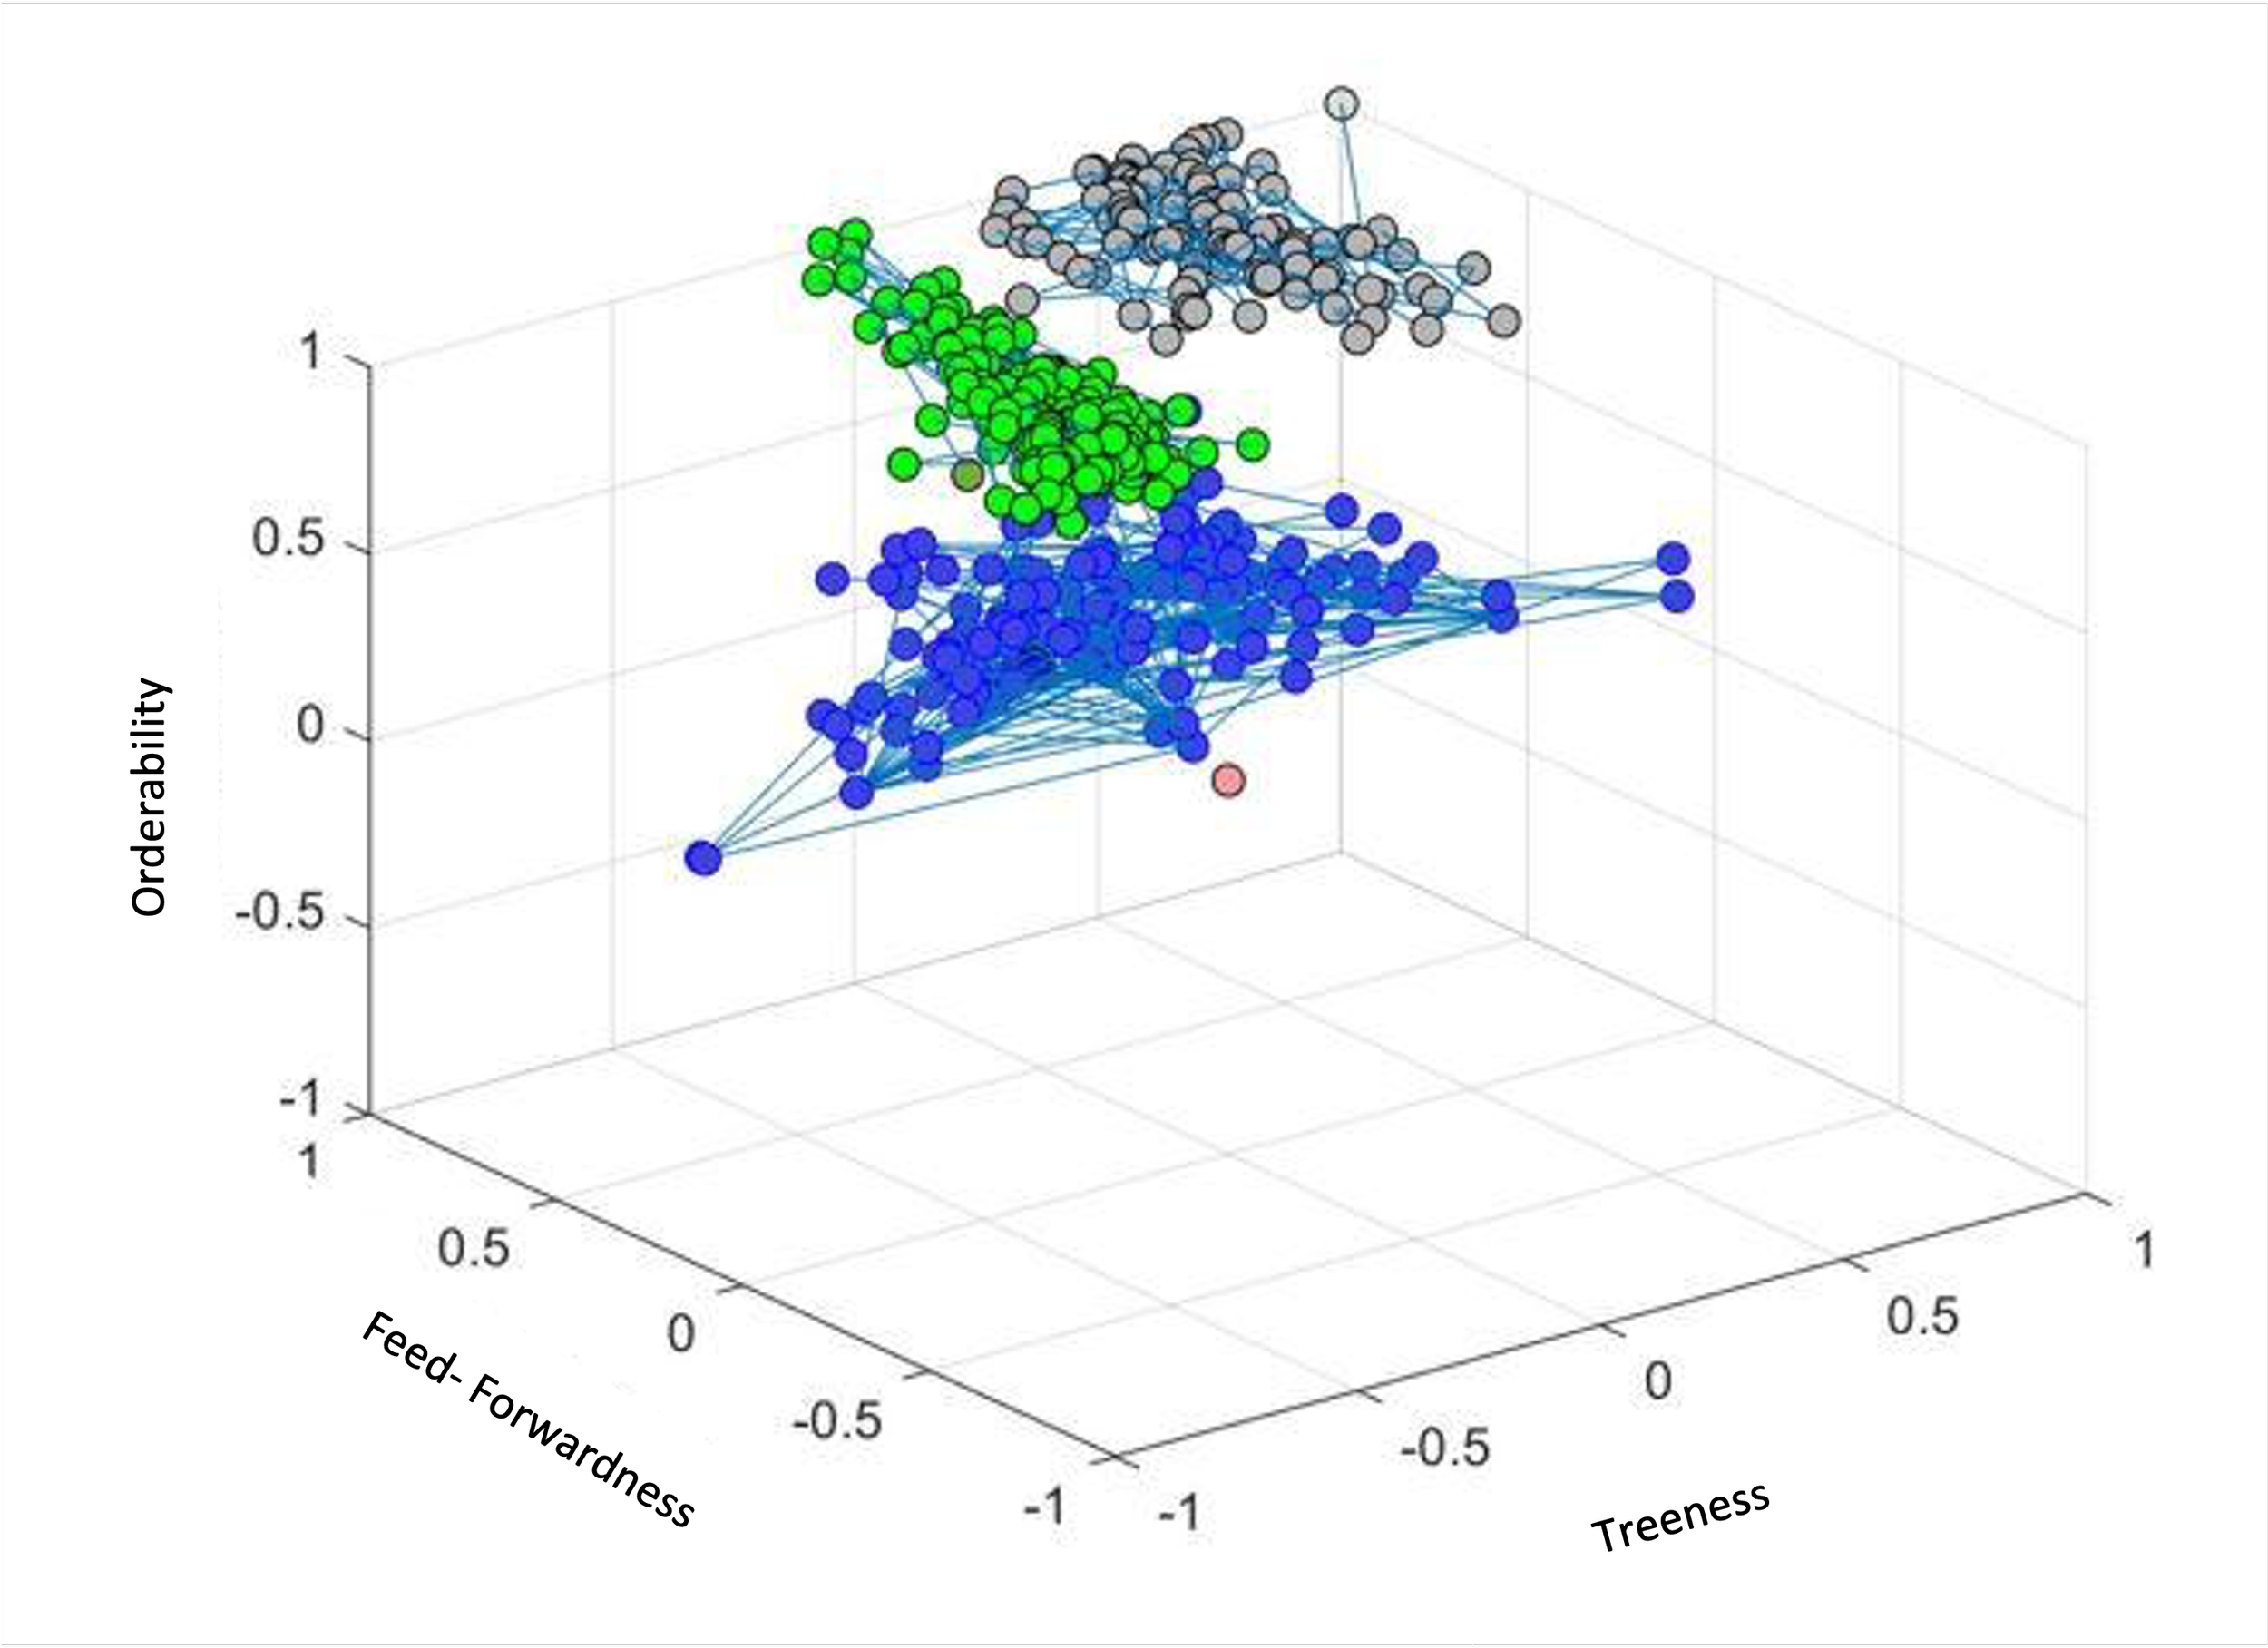
Fig. 9a Network Morphospace (numChanges: 100, numsteps: 10)Fig. 9b Network Morphospace (numChanges: 2000, numsteps: 200)Fig. 9c Network Morphospace (numChanges: 2000, numsteps: 500)The networks within the morphospace figure 9a were randomized to disintegrate the properties T, F, O and observe their properties. In the figure above each network was randomized over ten iterations for one hundred changes. Within the randomization procedure, edges may be switched or flipped, hence affecting both the cyclic processes as well as the perceived chain of command.
In the morphospace figure 9b, the larger number of iterations depict the potential space the four types of hierarchy may occupy as the hierarchy is further disintegrated. This can be more representative of real-world organizations that may want to subscribe to a certain model but due to realistic limitations, such as subjectivity in the application, may resemble any of the randomized models depending on the accuracy of implementation in terms of their T, F, O attributes.
Figure 9c alongside represents the four hierarchies with further disintegrations, up to 500 per generated network. This allows a comparison of the aspects of characteristic overlap of the preset notions that were used to design the generative models. As is notable from the plot, some randomized flatarchies seem to overlap in the region of flatter hierarchies. These special relations can be particularly helpful for organizations that are trying to develop dynamic structures that borrow from the advantages of multiple networks.
Furthermore, it is clear from the morphospace representations that the factors T,F,O which can be perceived in a real-world context as a scale for the chain of command and the stringency of control within an organization tend to fall as network structure progresses from that of typical, to flatter, to a flatarchy, and finally a flat hierarchical structure
References
Avena-Koenigsberger A, Gon˜i J, Sole´ R, Sporns O. 2015 Network morphospace. J. R. Soc. Interface 12: 20140881. http://dx.doi.org/10.1098/rsif.2014.0881
Morgan, J. (2015, July 20). The 5 Types Of Organizational Structures: Part 1, The Hierarchy. Retrieved from https://www.forbes.com/sites/jacobmorgan/2015/07/06/the-5-types-of-organizational-structures-part-1-the-hierarchy/
Murtraa, B. B., & Goñi, J. (2013, June 24). On the origins of hierarchy in complex networks. Retrieved from http://www.pnas.org/content/suppl/2013/07/25/1300832110.DCSupplemental